Using GCC with MinGW
In this tutorial, you configure Visual Studio Code to use the GCC C++ compiler (g++) and GDB debugger from mingw-w64 to create programs that run on Windows.
After configuring VS Code, you will compile and debug a simple Hello World program in VS Code. This tutorial does not teach you about GCC, GDB, Mingw-w64, or the C++ language. For those subjects, there are many good resources available on the Web.
If you have any problems, feel free to file an issue for this tutorial in the VS Code documentation repository.
Prerequisites
To successfully complete this tutorial, you must do the following steps:
-
Install Visual Studio Code.
-
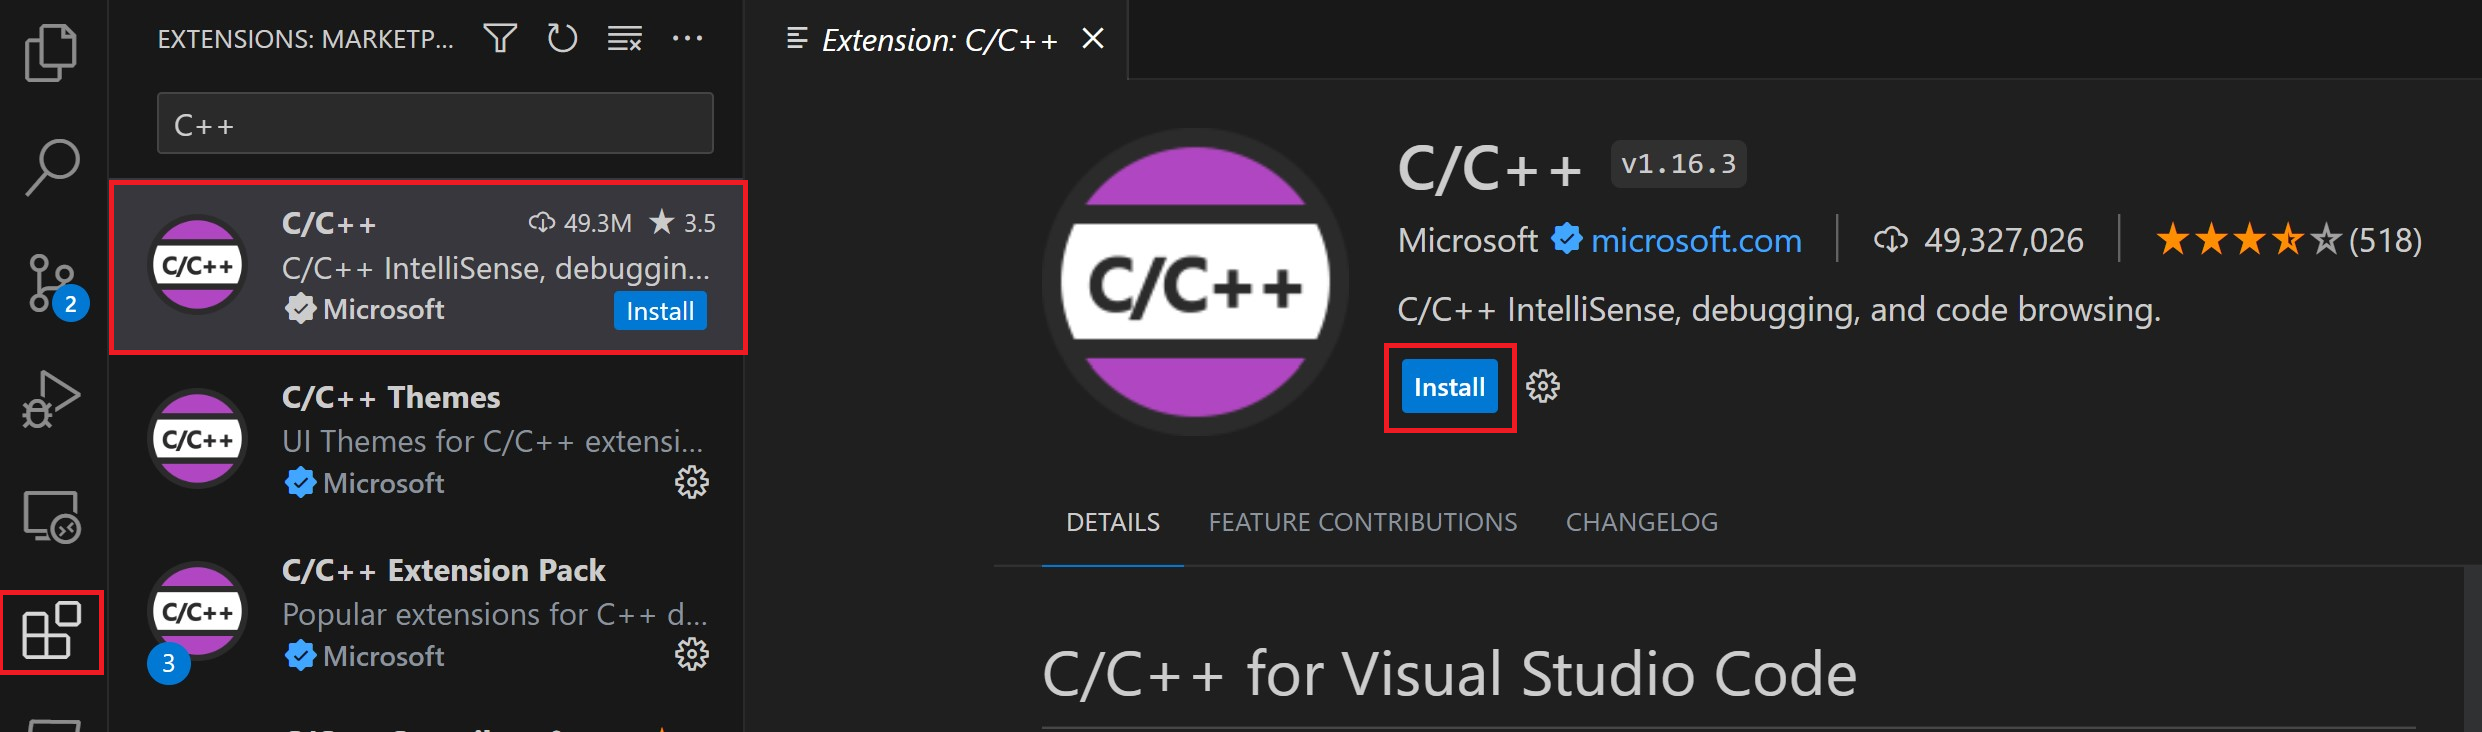
Install the C/C++ extension for VS Code. You can install the C/C++ extension by searching for ‘c++’ in the Extensions view (⇧⌘X (Windows, Linux Ctrl+Shift+X)).

-
Get the latest version of Mingw-w64 via MSYS2, which provides up-to-date native builds of GCC, Mingw-w64, and other helpful C++ tools and libraries. You can download the latest installer from the MSYS2 page or use this link to the installer.
-
Follow the Installation instructions on the MSYS2 website to install Mingw-w64. Take care to run each required Start menu and
pacmancommand. -
Install the Mingw-w64 toolchain (
pacman -S --needed base-devel mingw-w64-x86_64-toolchain). Run thepacmancommand in a MSYS2 terminal. Accept the default to install all the members in thetoolchaingroup. -
Add the path to your Mingw-w64
binfolder to the WindowsPATHenvironment variable by using the following steps:- In the Windows search bar, type ‘settings’ to open your Windows Settings.
- Search for Edit environment variables for your account.
- Choose the
Pathvariable in your User variables and then select Edit. - Select New and add the Mingw-w64 destination folder path to the system path. The exact path depends on which version of Mingw-w64 you have installed and where you installed it. If you used the settings above to install Mingw-w64, then add this to the path:
C:msys64mingw64bin. - Select OK to save the updated PATH. You will need to reopen any console windows for the new PATH location to be available.
Check your MinGW installation
To check that your Mingw-w64 tools are correctly installed and available, open a new Command Prompt and type:
gcc --version
g++ --version
gdb --version
- If you don’t see the expected output or
g++orgdbis not a recognized command, make sure your PATH entry matches the Mingw-w64 binary location where the compilers are located. If the compilers do not exist at that PATH entry, make sure you followed the instructions on the MSYS2 website to install Mingw-w64. - If
gcchas the correct output but notgdb, then you need to install the packages you are missing from the Mingw-w64 toolset.- Missing the
mingw-w64-gdbpackage is one cause of the «The value of miDebuggerPath is invalid.» message upon attempted compilation if your PATH is correct.
- Missing the
Create Hello World
From a Windows command prompt, create an empty folder called projects where you can place all your VS Code projects. Then create a sub-folder called helloworld, navigate into it, and open VS Code in that folder by entering the following commands:
mkdir projects
cd projects
mkdir helloworld
cd helloworld
code .
The «code .» command opens VS Code in the current working folder, which becomes your «workspace». Accept the Workspace Trust dialog by selecting Yes, I trust the authors since this is a folder you created.
As you go through the tutorial, you will see three files created in a .vscode folder in the workspace:
tasks.json(build instructions)launch.json(debugger settings)c_cpp_properties.json(compiler path and IntelliSense settings)
Add a source code file
In the File Explorer title bar, select the New File button and name the file helloworld.cpp.

Add hello world source code
Now paste in this source code:
#include <iostream>
#include <vector>
#include <string>

using namespace std;

int main()
{
    vector<string> msg {"Hello", "C++", "World", "from", "VS Code", "and the C++ extension!"};

    for (const string& word : msg)
    {
        cout << word << " ";
    }
    cout << endl;
}
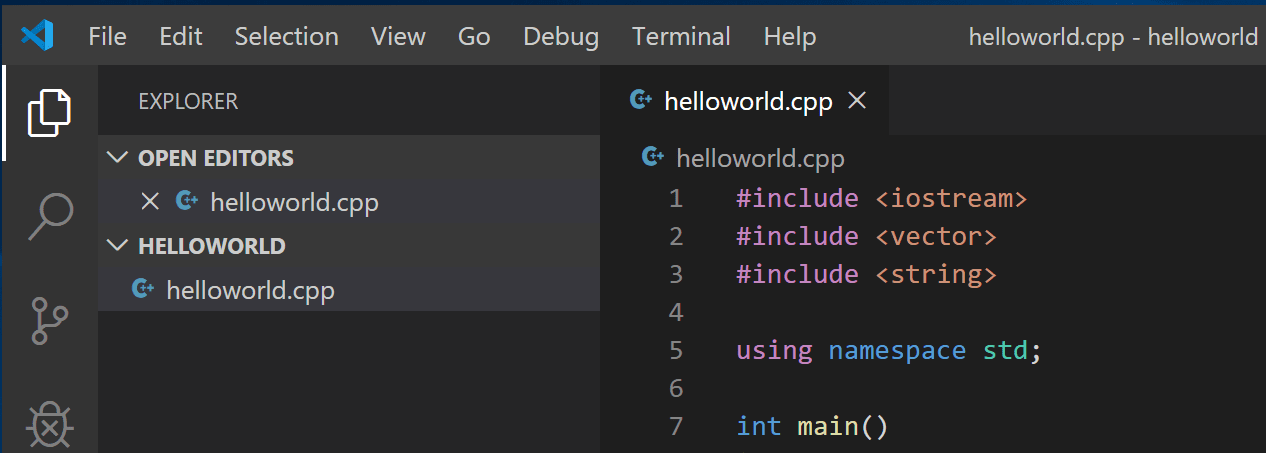
Now press ⌘S (Windows, Linux Ctrl+S) to save the file. Notice how the file you just added appears in the File Explorer view (⇧⌘E (Windows, Linux Ctrl+Shift+E)) in the side bar of VS Code:
You can also enable Auto Save to automatically save your file changes, by checking Auto Save in the main File menu.
The Activity Bar on the far left lets you open different views such as Search, Source Control, and Run. You’ll look at the Run view later in this tutorial. You can find out more about the other views in the VS Code User Interface documentation.
Note: When you save or open a C++ file, you may see a notification from the C/C++ extension about the availability of an Insiders version, which lets you test new features and fixes. You can ignore this notification by selecting the
X(Clear Notification).
Explore IntelliSense
In your new helloworld.cpp file, hover over vector or string to see type information. After the declaration of the msg variable, start typing msg. as you would when calling a member function. You should immediately see a completion list that shows all the member functions, and a window that shows the type information for the msg object:
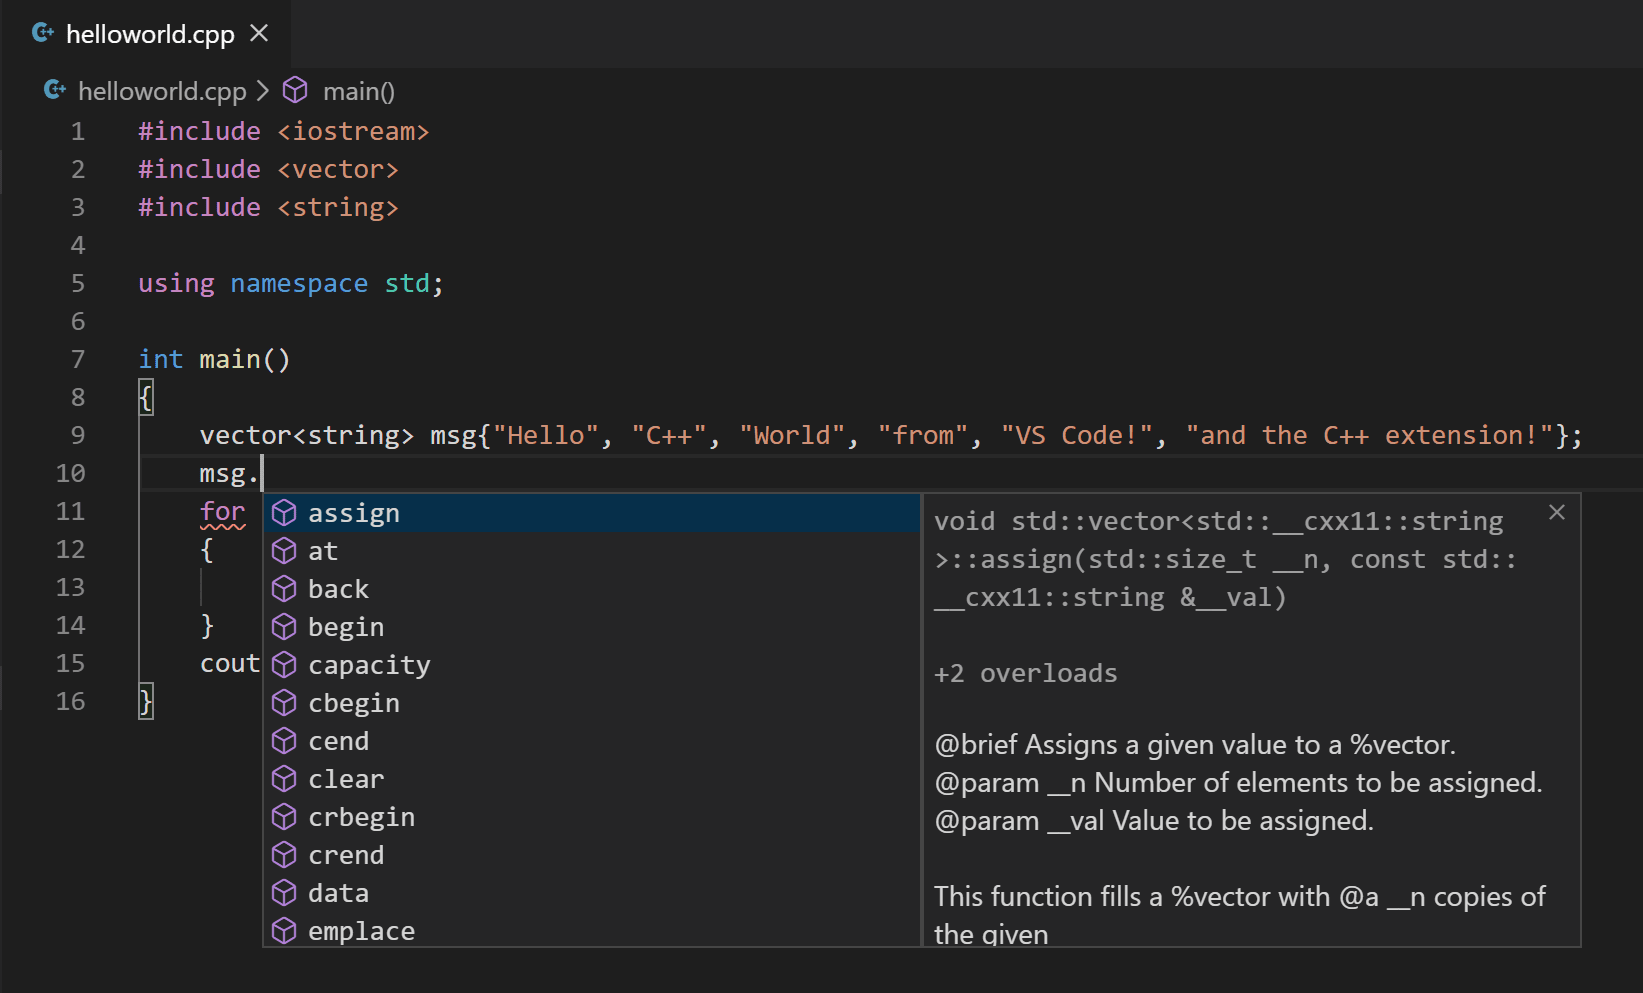
You can press the Tab key to insert the selected member; then, when you add the opening parenthesis, you will see information about any arguments that the function requires.
Run helloworld.cpp
Remember, the C++ extension uses the C++ compiler you have installed on your machine to build your program. Make sure you have a C++ compiler installed before attempting to run and debug helloworld.cpp in VS Code.
-
Open
helloworld.cppso that it is the active file. -
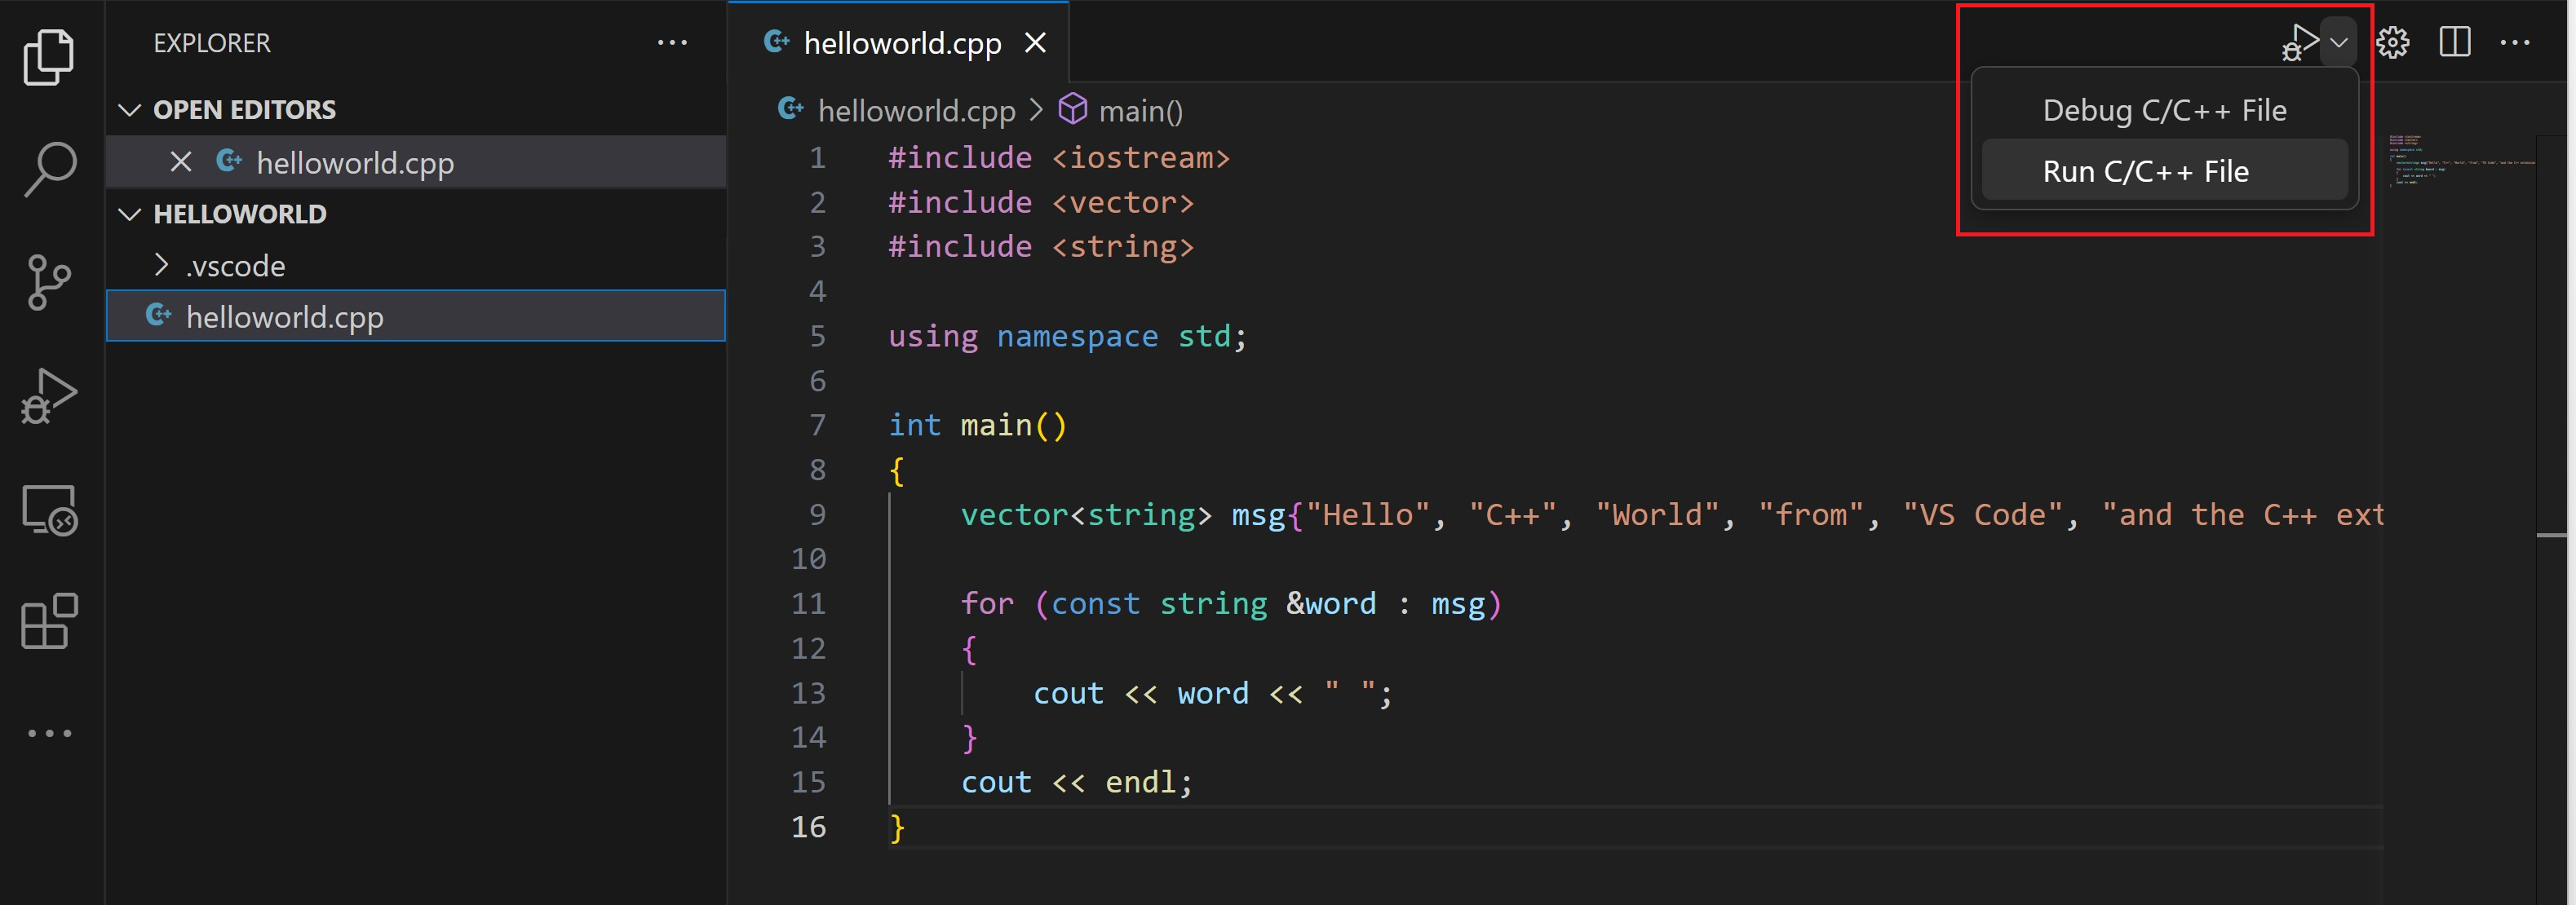
Press the play button in the top right corner of the editor.
-
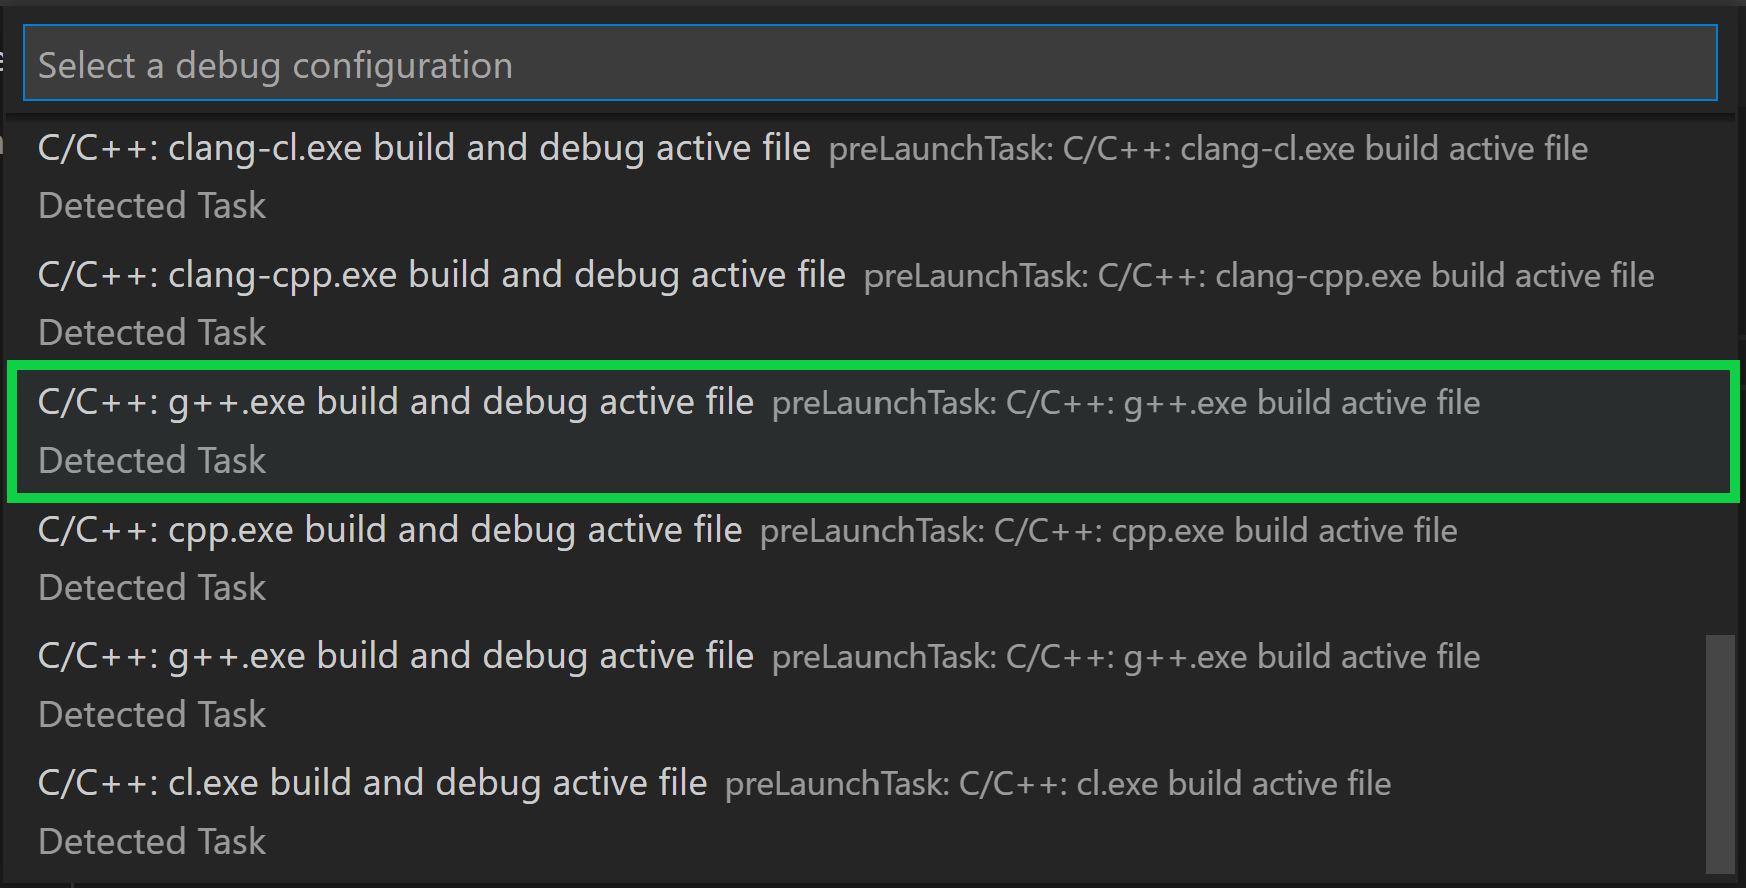
Choose C/C++: g++.exe build and debug active file from the list of detected compilers on your system.
You’ll only be asked to choose a compiler the first time you run helloworld.cpp. This compiler will be set as the «default» compiler in tasks.json file.
-
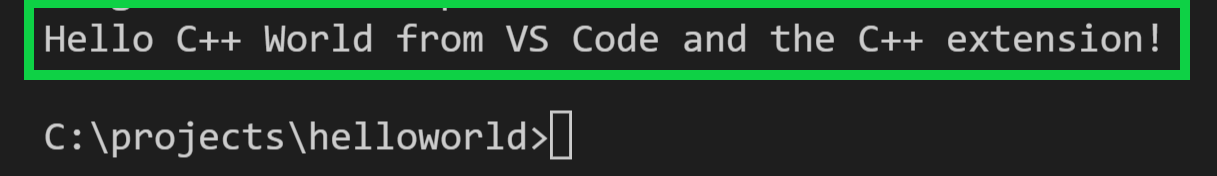
After the build succeeds, your program’s output will appear in the integrated Terminal.
The first time you run your program, the C++ extension creates tasks.json, which you’ll find in your project’s .vscode folder. tasks.json stores build configurations.
Your new tasks.json file should look similar to the JSON below:
{
  "tasks": [
    {
      "type": "cppbuild",
      "label": "C/C++: g++.exe build active file",
      "command": "C:\msys64\mingw64\bin\g++.exe",
      "args": [
        "-fdiagnostics-color=always",
        "-g",
        "${file}",
        "-o",
        "${fileDirname}\${fileBasenameNoExtension}.exe"
      ],
      "options": {
        "cwd": "${fileDirname}"
      },
      "problemMatcher": ["$gcc"],
      "group": {
        "kind": "build",
        "isDefault": true
      },
      "detail": "Task generated by Debugger."
    }
  ],
  "version": "2.0.0"
}
Note: You can learn more about
tasks.jsonvariables in the variables reference.
The command setting specifies the program to run; in this case that is g++.
The args array specifies the command-line arguments that will be passed to g++. These arguments must be specified in the order expected by the compiler.
This task tells g++ to take the active file (${file}), compile it, and create an executable file in the current directory (${fileDirname}) with the same name as the active file but with the .exe extension (${fileBasenameNoExtension}.exe), resulting in helloworld.exe for our example.
The label value is what you will see in the tasks list; you can name this whatever you like.
The detail value is what you will as the description of the task in the tasks list. It’s highly recommended to rename this value to differentiate it from similar tasks.
From now on, the play button will read from tasks.json to figure out how to build and run your program. You can define multiple build tasks in tasks.json, and whichever task is marked as the default will be used by the play button. In case you need to change the default compiler, you can run Tasks: Configure default build task. Alternatively you can modify the tasks.json file and remove the default by replacing this segment:
    "group": {
        "kind": "build",
        "isDefault": true
    },
with this:
"group": "build",
Modifying tasks.json
You can modify your tasks.json to build multiple C++ files by using an argument like "${workspaceFolder}/*.cpp" instead of ${file}.This will build all .cpp files in your current folder. You can also modify the output filename by replacing "${fileDirname}\${fileBasenameNoExtension}.exe" with a hard-coded filename (for example "${workspaceFolder}\myProgram.exe").
Debug helloworld.cpp
- Go back to
helloworld.cppso that it is the active file. - Set a breakpoint by clicking on the editor margin or using F9 on the current line.
- From the drop-down next to the play button, select Debug C/C++ File.
- Choose C/C++: g++ build and debug active file from the list of detected compilers on your system (you’ll only be asked to choose a compiler the first time you run/debug
helloworld.cpp).
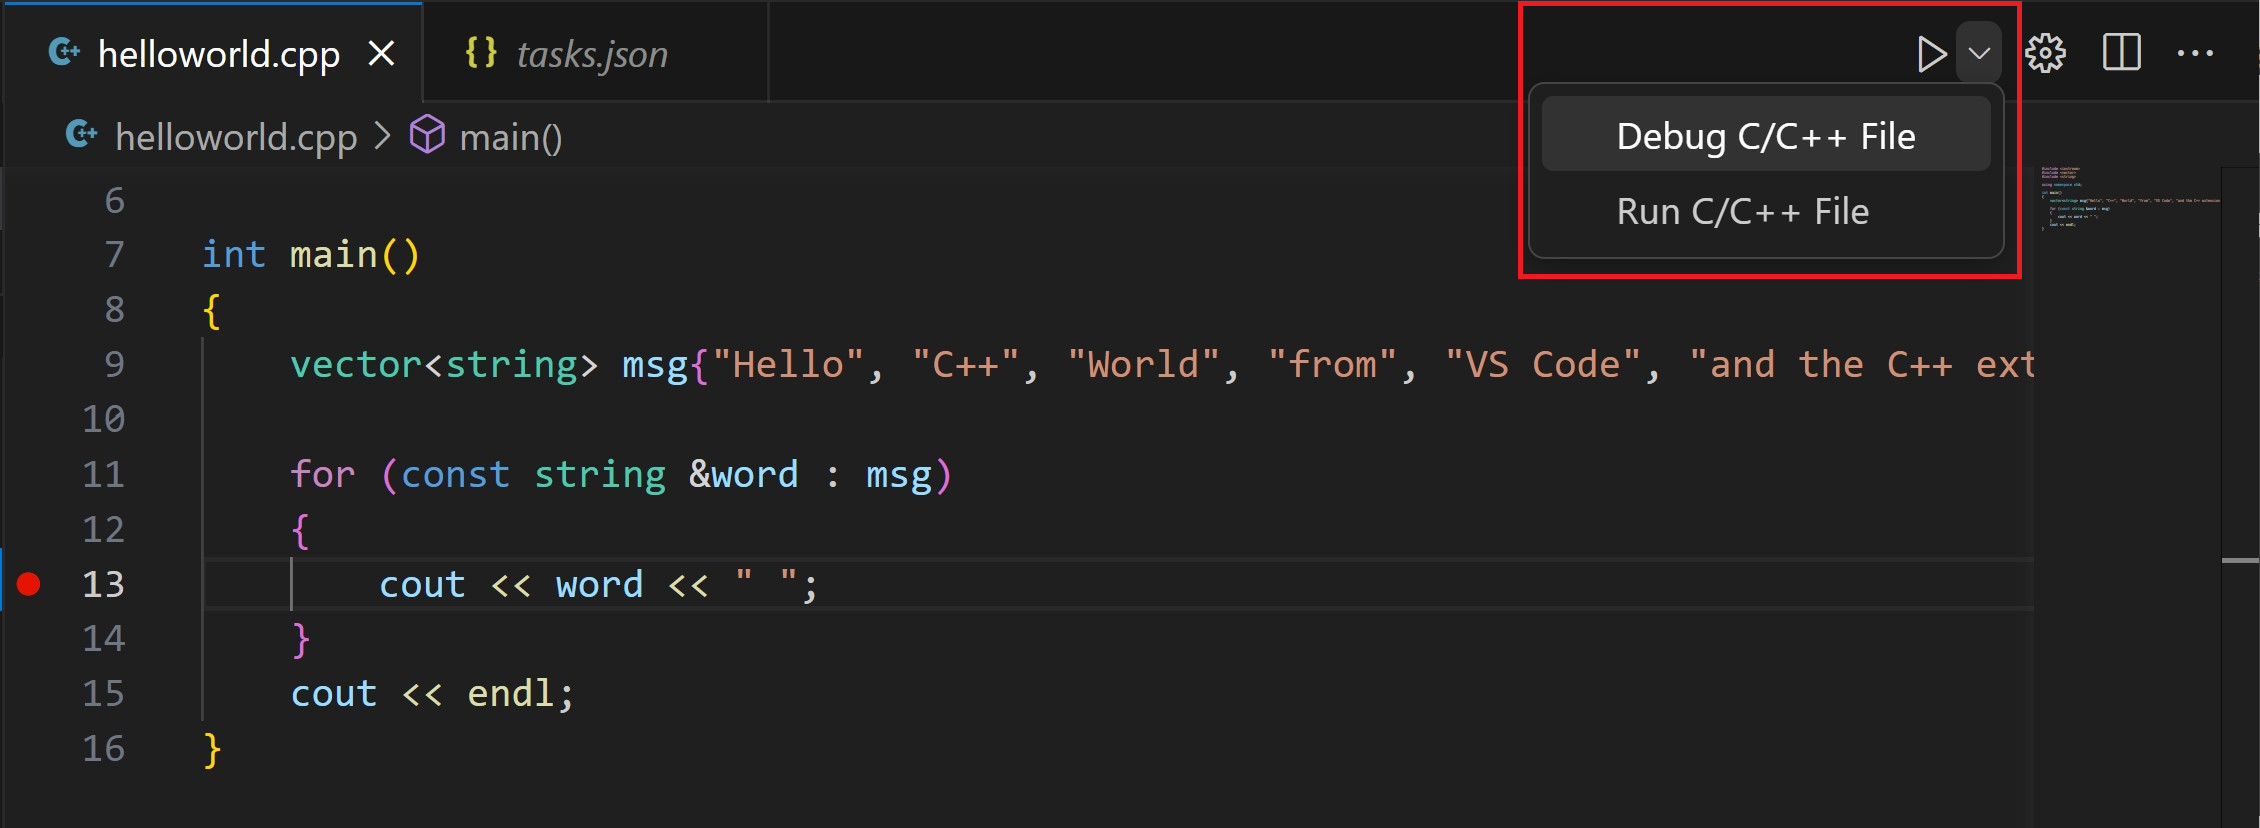
The play button has two modes: Run C/C++ File and Debug C/C++ File. It will default to the last-used mode. If you see the debug icon in the play button, you can just click the play button to debug, instead of using the drop-down.

Explore the debugger
Before you start stepping through the code, let’s take a moment to notice several changes in the user interface:
-
The Integrated Terminal appears at the bottom of the source code editor. In the Debug Output tab, you see output that indicates the debugger is up and running.
-
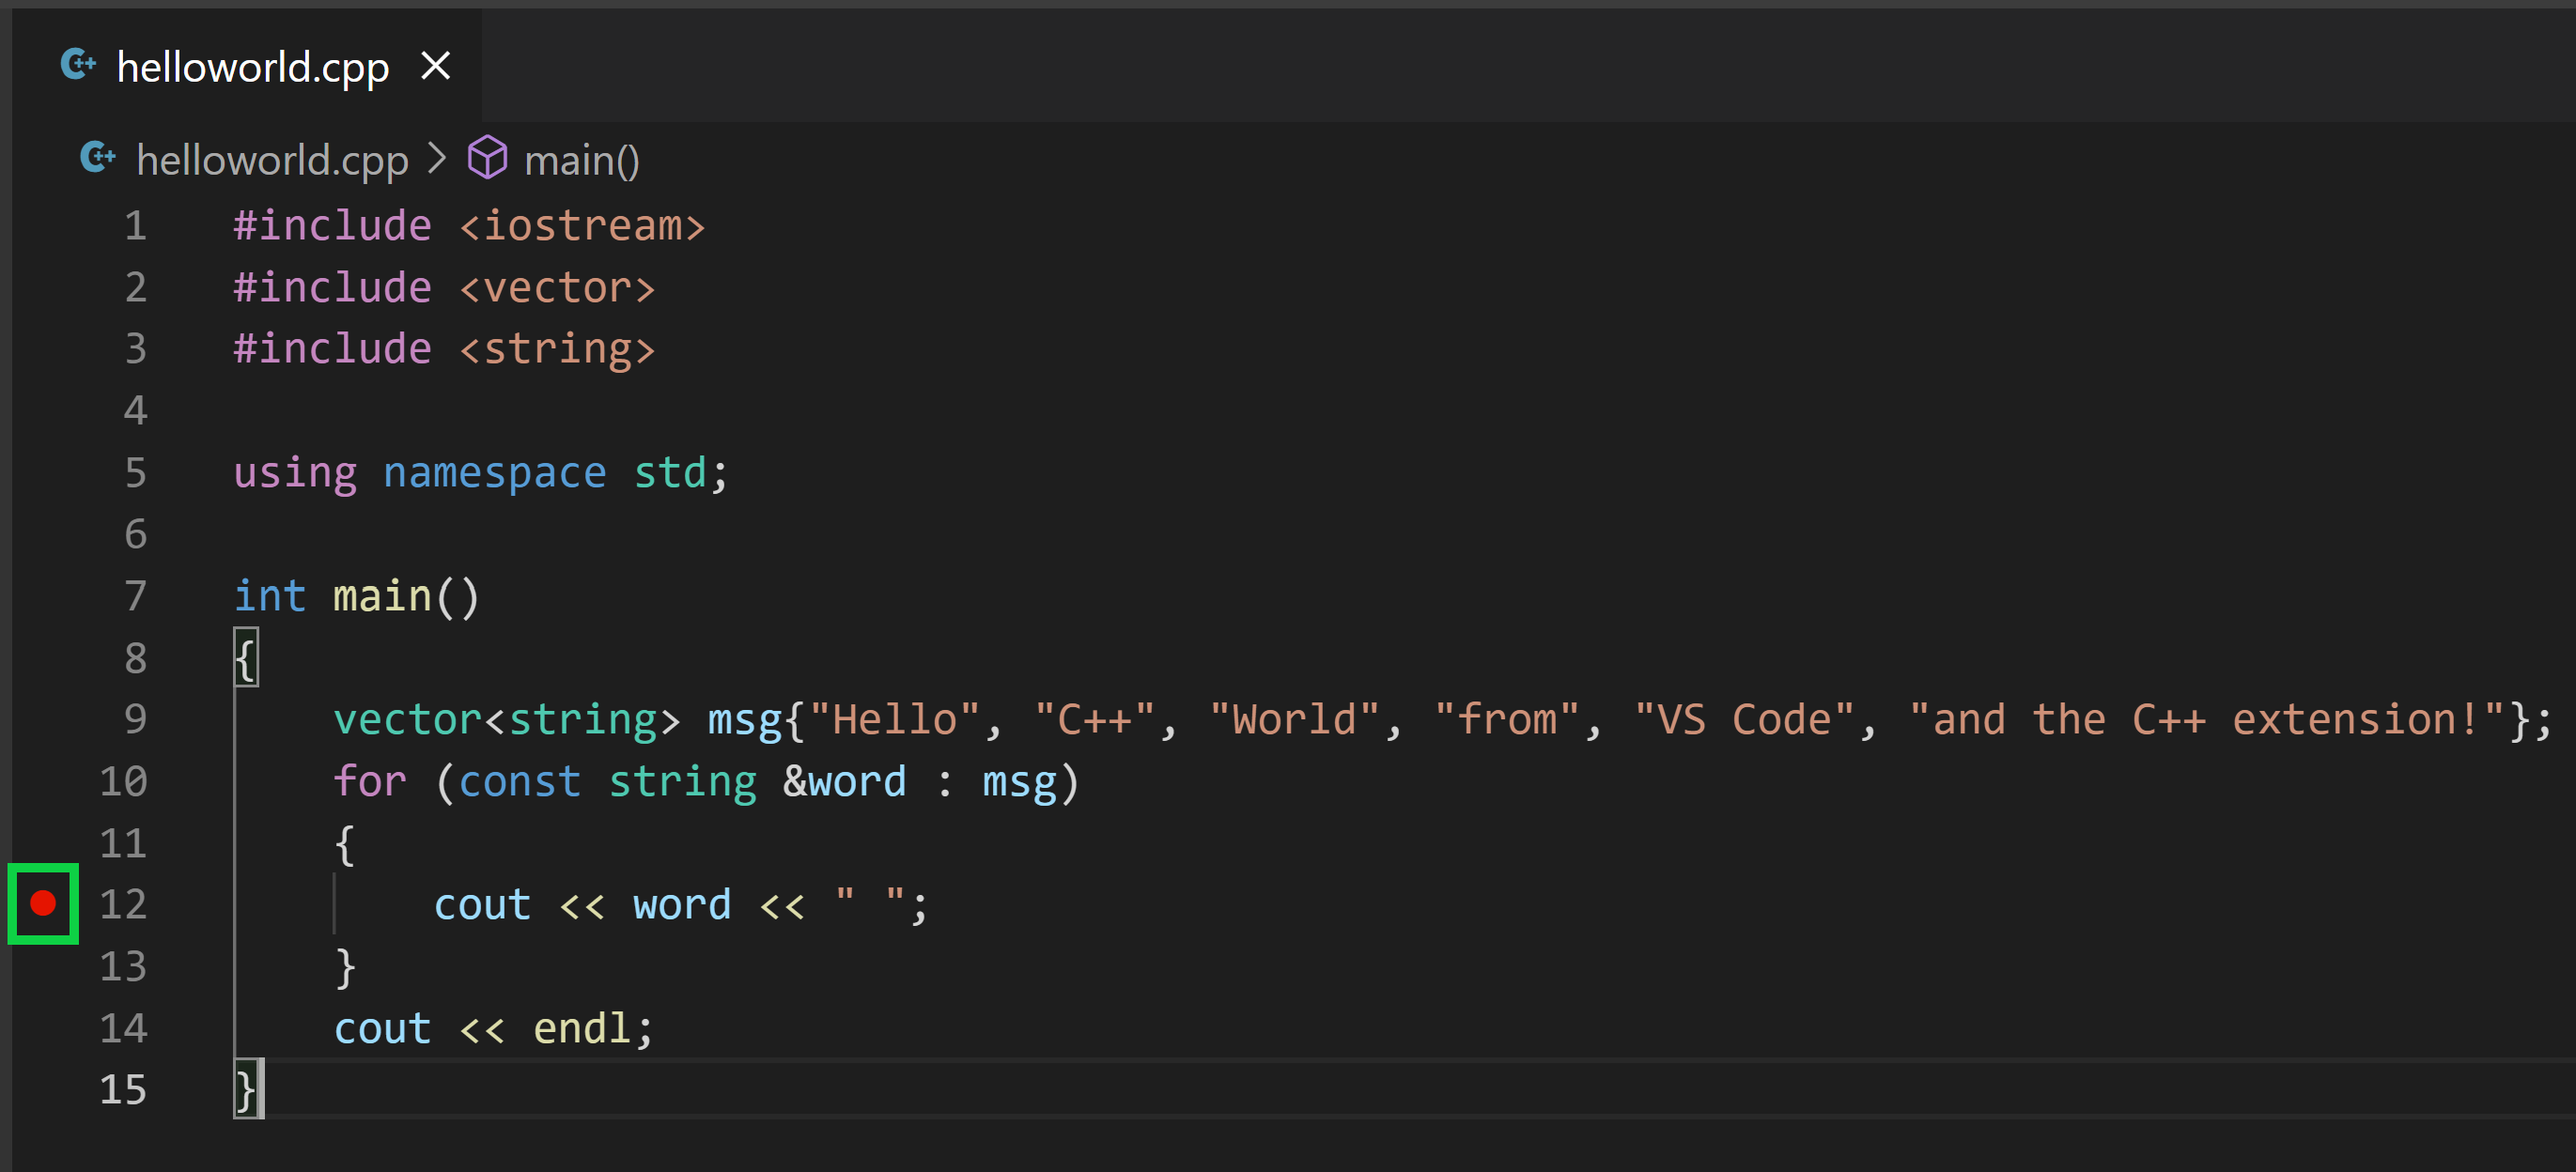
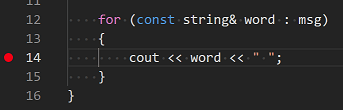
The editor highlights the line where you set a breakpoint before starting the debugger:
-
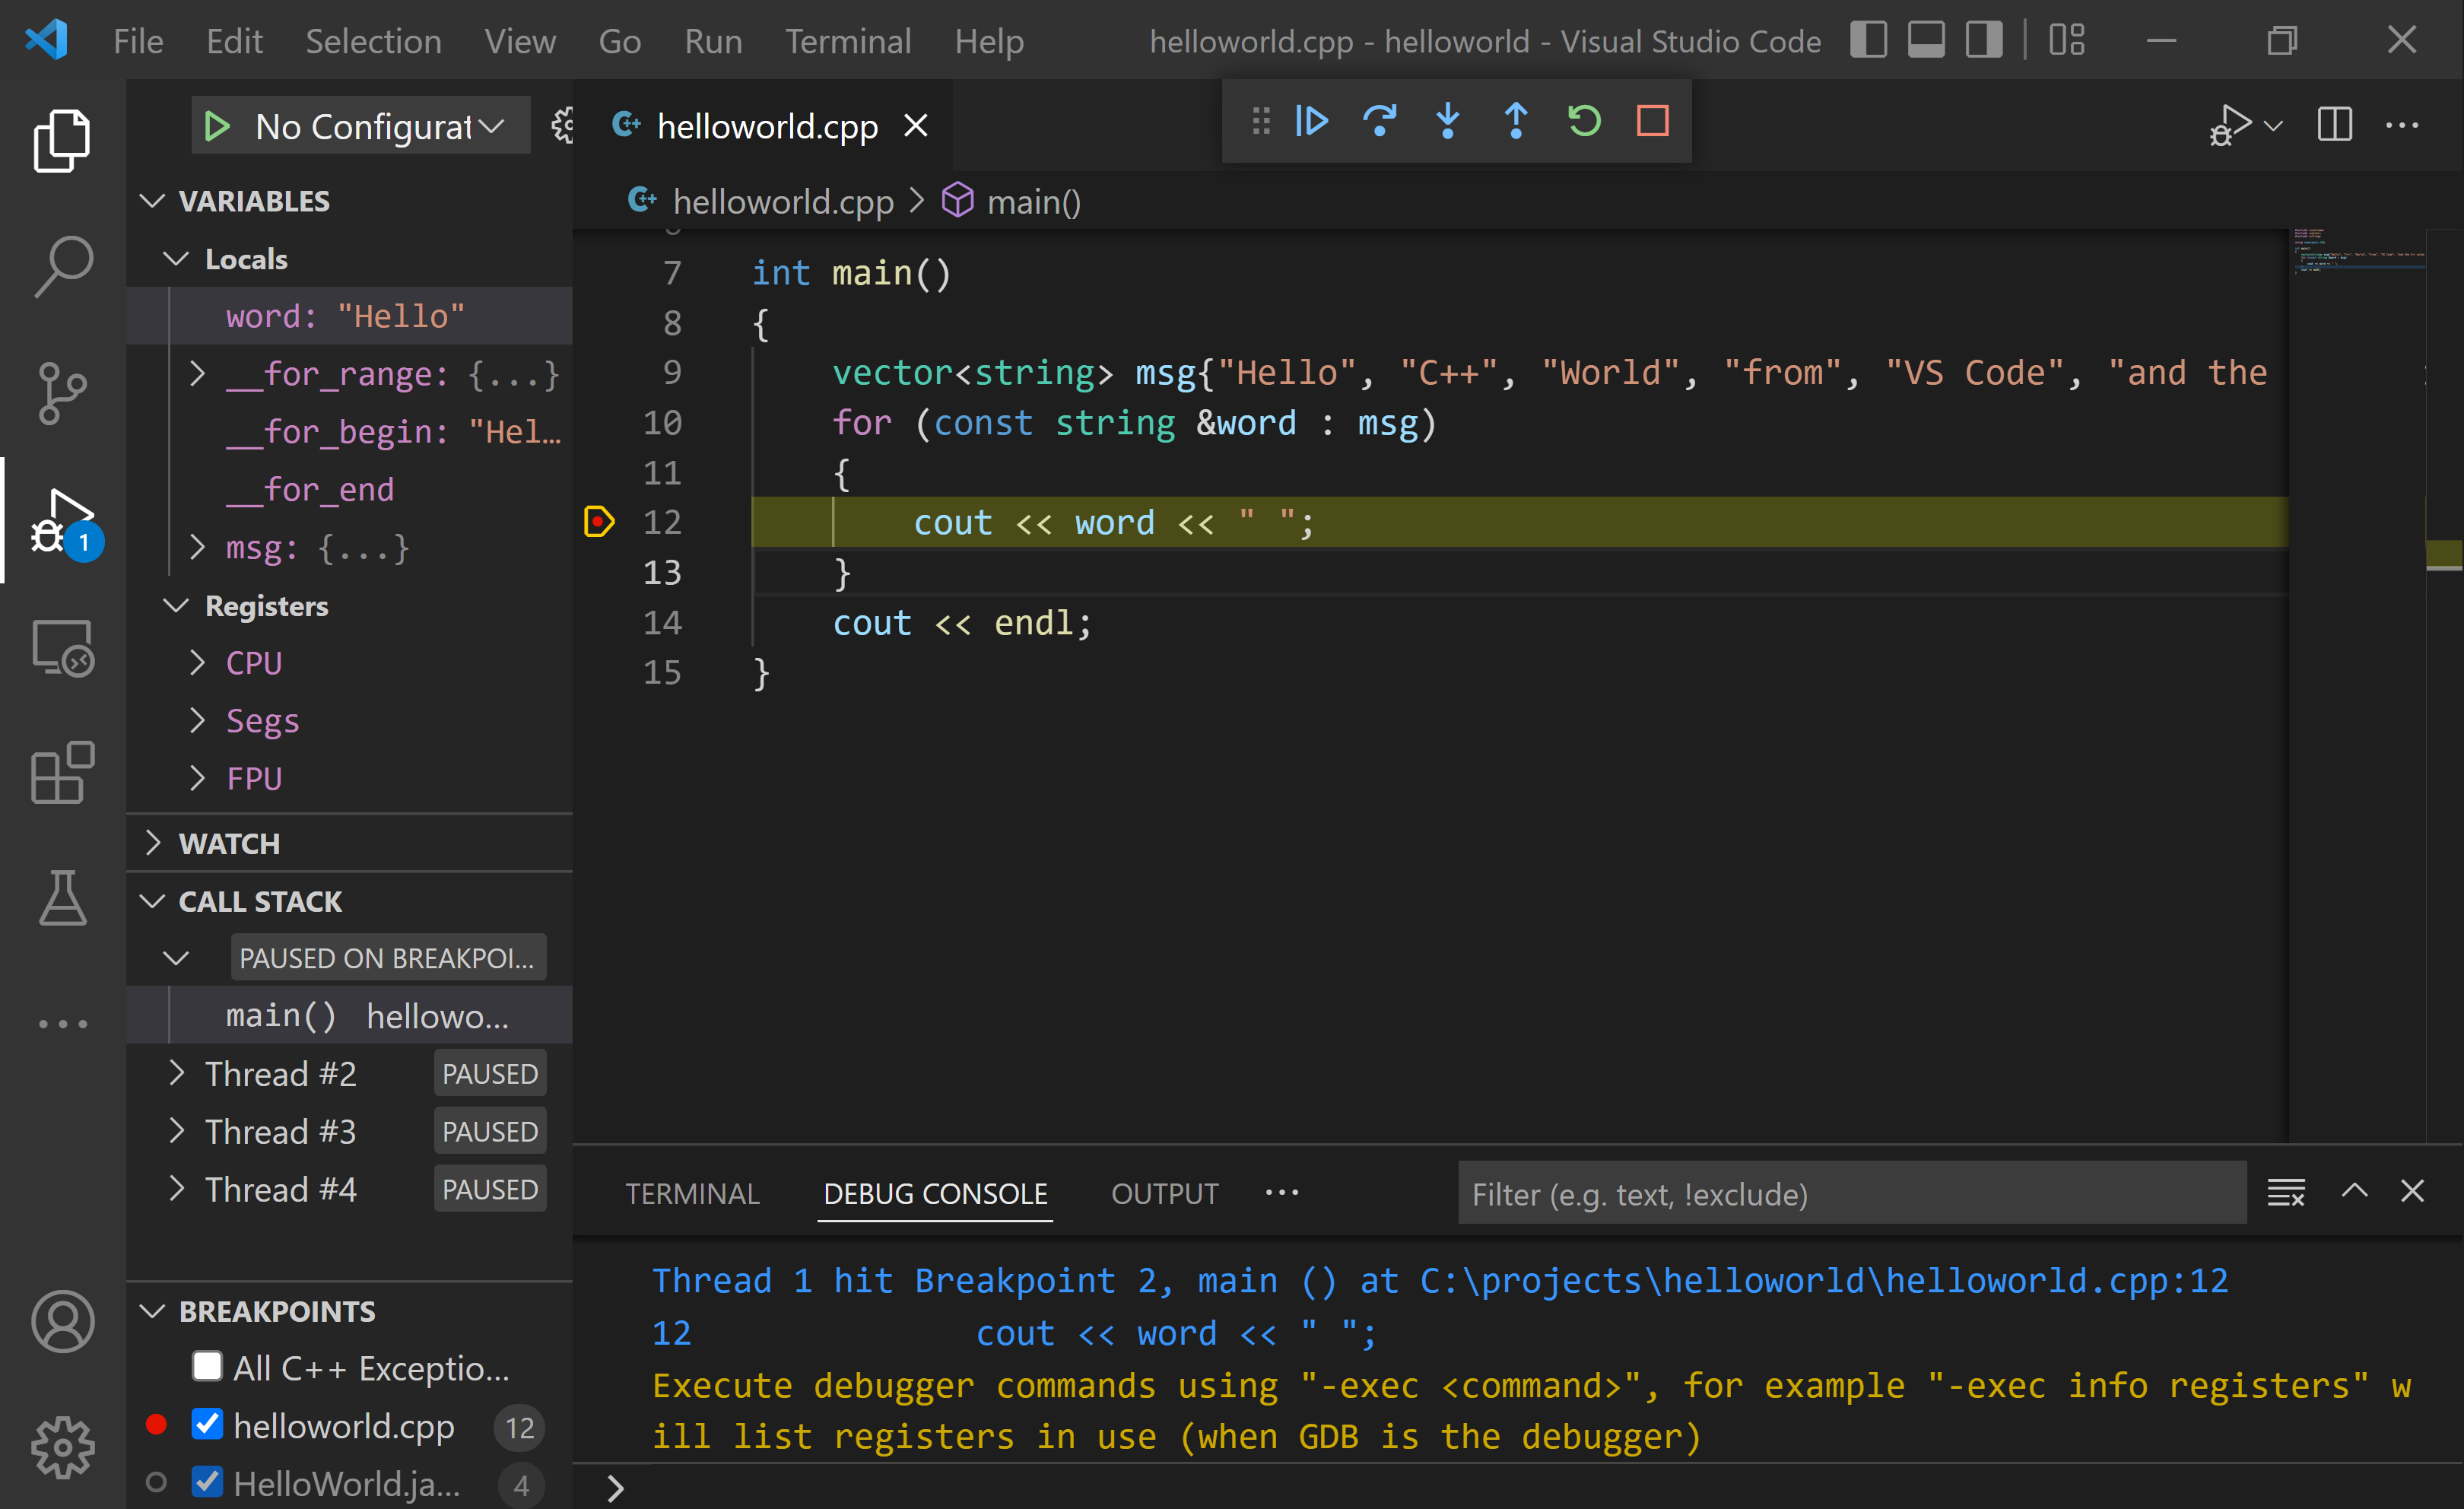
The Run and Debug view on the left shows debugging information. You’ll see an example later in the tutorial.
-
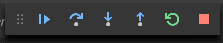
At the top of the code editor, a debugging control panel appears. You can move this around the screen by grabbing the dots on the left side.
Step through the code
Now you’re ready to start stepping through the code.
-
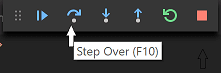
Click or press the Step over icon in the debugging control panel.
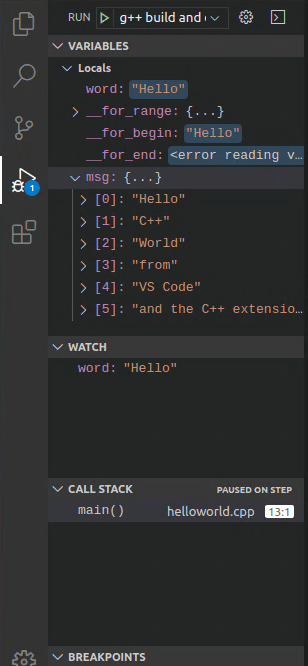
This will advance program execution to the first line of the for loop, and skip over all the internal function calls within the
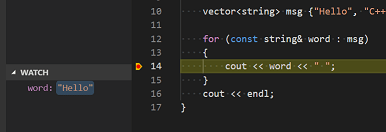
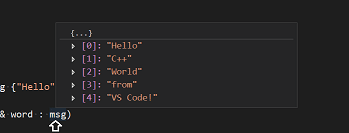
vectorandstringclasses that are invoked when themsgvariable is created and initialized. Notice the change in the Variables window on the left.In this case, the errors are expected because, although the variable names for the loop are now visible to the debugger, the statement has not executed yet, so there is nothing to read at this point. The contents of
msgare visible, however, because that statement has completed. -
Press Step over again to advance to the next statement in this program (skipping over all the internal code that is executed to initialize the loop). Now, the Variables window shows information about the loop variables.
-
Press Step over again to execute the
coutstatement. (Note that as of the March 2019 release, the C++ extension does not print any output to the Debug Console until the loop exits.) -
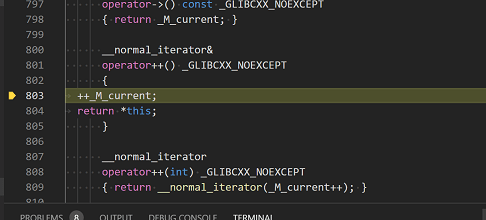
If you like, you can keep pressing Step over until all the words in the vector have been printed to the console. But if you are curious, try pressing the Step Into button to step through source code in the C++ standard library!
To return to your own code, one way is to keep pressing Step over. Another way is to set a breakpoint in your code by switching to the
helloworld.cpptab in the code editor, putting the insertion point somewhere on thecoutstatement inside the loop, and pressing F9. A red dot appears in the gutter on the left to indicate that a breakpoint has been set on this line.Then press F5 to start execution from the current line in the standard library header. Execution will break on
cout. If you like, you can press F9 again to toggle off the breakpoint.When the loop has completed, you can see the output in the Integrated Terminal, along with some other diagnostic information that is output by GDB.

Set a watch
Sometimes you might want to keep track of the value of a variable as your program executes. You can do this by setting a watch on the variable.
-
Place the insertion point inside the loop. In the Watch window, click the plus sign and in the text box, type
word, which is the name of the loop variable. Now view the Watch window as you step through the loop. -
Add another watch by adding this statement before the loop:
int i = 0;. Then, inside the loop, add this statement:++i;. Now add a watch forias you did in the previous step. -
To quickly view the value of any variable while execution is paused on a breakpoint, you can hover over it with the mouse pointer.
Customize debugging with launch.json
When you debug with the play button or F5, the C++ extension creates a dynamic debug configuration on the fly.
There are cases where you’d want to customize your debug configuration, such as specifying arguments to pass to the program at runtime. You can define custom debug configurations in a launch.json file.
To create launch.json, choose Add Debug Configuration from the play button drop-down menu.
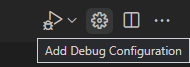
You’ll then see a dropdown for various predefined debugging configurations. Choose C/C++: g++.exe build and debug active file.
VS Code creates a launch.json file, which looks something like this:
{
  "version": "0.2.0",
  "configurations": [
    {
      "name": "C/C++: g++.exe build and debug active file",
      "type": "cppdbg",
      "request": "launch",
      "program": "${fileDirname}\${fileBasenameNoExtension}.exe",
      "args": [],
      "stopAtEntry": false,
      "cwd": "${fileDirname}",
      "environment": [],
      "externalConsole": false,
      "MIMode": "gdb",
      "miDebuggerPath": "C:\msys64\mingw64\bin\gdb.exe",
      "setupCommands": [
        {
          "description": "Enable pretty-printing for gdb",
          "text": "-enable-pretty-printing",
          "ignoreFailures": true
        }
      ],
      "preLaunchTask": "C/C++: g++.exe build active file"
    }
  ]
}
In the JSON above, program specifies the program you want to debug. Here it is set to the active file folder (${fileDirname}) and active filename with the .exe extension (${fileBasenameNoExtension}.exe), which if helloworld.cpp is the active file will be helloworld.exe. The args property is an array of arguments to pass to the program at runtime.
By default, the C++ extension won’t add any breakpoints to your source code and the stopAtEntry value is set to false.
Change the stopAtEntry value to true to cause the debugger to stop on the main method when you start debugging.
From now on, the play button and F5 will read from your
launch.jsonfile when launching your program for debugging.
C/C++ configurations
If you want more control over the C/C++ extension, you can create a c_cpp_properties.json file, which will allow you to change settings such as the path to the compiler, include paths, C++ standard (default is C++17), and more.
You can view the C/C++ configuration UI by running the command C/C++: Edit Configurations (UI) from the Command Palette (⇧⌘P (Windows, Linux Ctrl+Shift+P)).
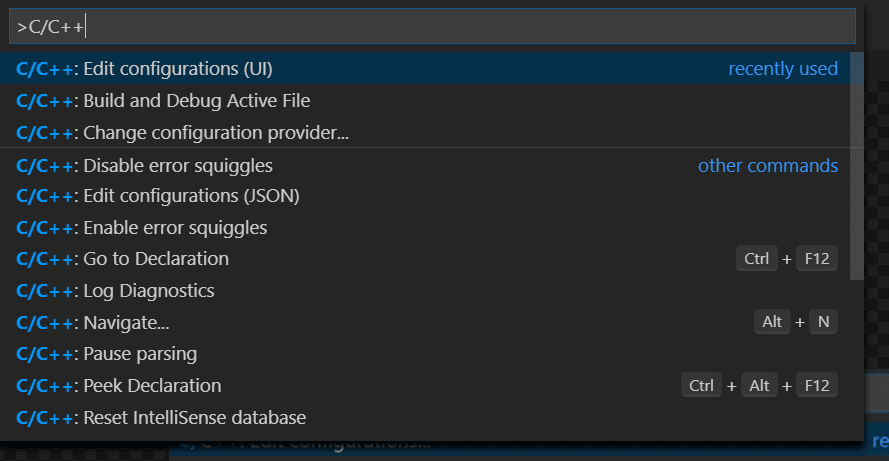
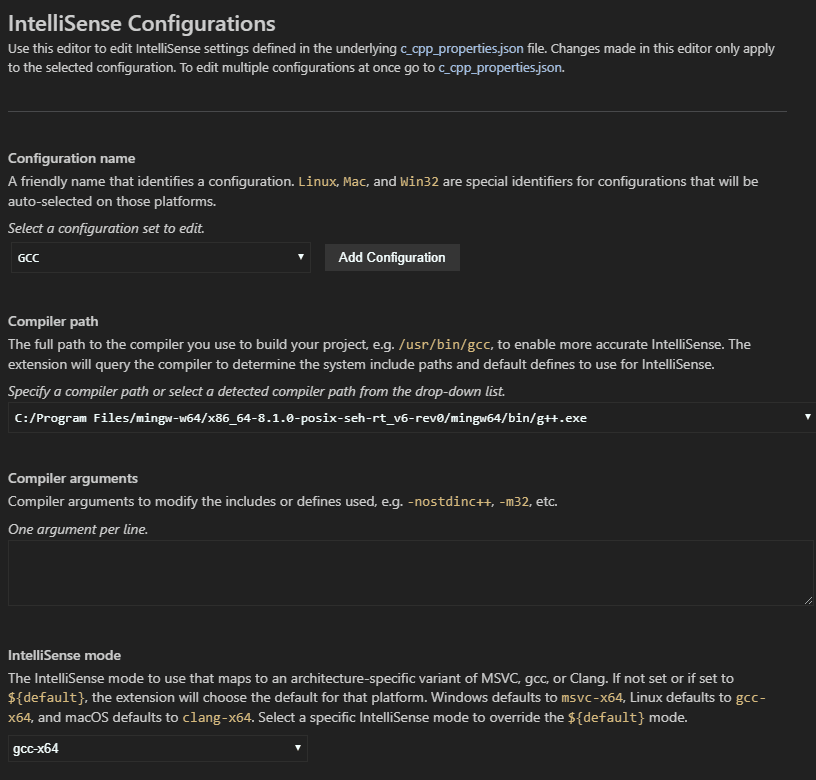
This opens the C/C++ Configurations page. When you make changes here, VS Code writes them to a file called c_cpp_properties.json in the .vscode folder.
Here, we’ve changed the Configuration name to GCC, set the Compiler path dropdown to the g++ compiler, and the IntelliSense mode to match the compiler (gcc-x64).
Visual Studio Code places these settings in .vscodec_cpp_properties.json. If you open that file directly, it should look something like this:
{
  "configurations": [
    {
      "name": "GCC",
      "includePath": ["${workspaceFolder}/**"],
      "defines": ["_DEBUG", "UNICODE", "_UNICODE"],
      "windowsSdkVersion": "10.0.18362.0",
      "compilerPath": "C:/msys64/mingw64/bin/g++.exe",
      "cStandard": "c17",
      "cppStandard": "c++17",
      "intelliSenseMode": "windows-gcc-x64"
    }
  ],
  "version": 4
}
You only need to add to the Include path array setting if your program includes header files that are not in your workspace or in the standard library path.
Compiler path
The extension uses the compilerPath setting to infer the path to the C++ standard library header files. When the extension knows where to find those files, it can provide features like smart completions and Go to Definition navigation.
The C/C++ extension attempts to populate compilerPath with the default compiler location based on what it finds on your system. The extension looks in several common compiler locations.
The compilerPath search order is:
- First check for the Microsoft Visual C++ compiler
- Then look for g++ on Windows Subsystem for Linux (WSL)
- Then g++ for Mingw-w64.
If you have Visual Studio or WSL installed, you may need to change compilerPath to match the preferred compiler for your project. For example, if you installed Mingw-w64 version 8.1.0 using the i686 architecture, Win32 threading, and sjlj exception handling install options, the path would look like this: C:Program Files (x86)mingw-w64i686-8.1.0-win32-sjlj-rt_v6-rev0mingw64bing++.exe.
Troubleshooting
MSYS2 is installed, but g++ and gdb are still not found
You must follow the steps on the MSYS2 website and use the MSYS CLI to install Mingw-w64, which contains those tools. You will also need to install the full Mingw-w64 toolchain (pacman -S --needed base-devel mingw-w64-x86_64-toolchain) to get the gdb debugger.
MinGW 32-bit
If you need a 32-bit version of the MinGW toolset, consult the Downloading section on the MSYS2 wiki. It includes links to both 32-bit and 64-bit installation options.
Next steps
- Explore the VS Code User Guide.
- Review the Overview of the C++ extension.
- Create a new workspace, copy your
.vscodeJSON files to it, adjust the necessary settings for the new workspace path, program name, and so on, and start coding!
5/13/2022
| Order | Area | TOCTitle | ContentId | PageTitle | DateApproved | MetaDescription |
|---|---|---|---|---|---|---|
|
6 |
cpp |
Microsoft C++ on Windows |
c8b779d6-79e2-49d6-acfc-430d7ac3a299 |
Configure Visual Studio Code for Microsoft C++ |
5/13/2022 |
Configure the C++ extension in Visual Studio Code to target Microsoft C++ on Windows. |
Configure VS Code for Microsoft C++
In this tutorial, you configure Visual Studio Code to use the Microsoft Visual C++ compiler and debugger on Windows.
After configuring VS Code, you will compile and debug a simple Hello World program in VS Code. This tutorial does not teach you details about the Microsoft C++ toolset or the C++ language. For those subjects, there are many good resources available on the Web.
If you have any problems, feel free to file an issue for this tutorial in the VS Code documentation repository.
Prerequisites
To successfully complete this tutorial, you must do the following:
-
Install Visual Studio Code.
-
Install the C/C++ extension for VS Code. You can install the C/C++ extension by searching for ‘c++’ in the Extensions view (
kb(workbench.view.extensions)). -
Install the Microsoft Visual C++ (MSVC) compiler toolset.
If you have a recent version of Visual Studio, open the Visual Studio Installer from the Windows Start menu and verify that the C++ workload is checked. If it’s not installed, then check the box and select the Modify button in the installer.
You can also install the Desktop development with C++ workload without a full Visual Studio IDE installation. From the Visual Studio Downloads page, scroll down until you see Tools for Visual Studio 2022 under the All Downloads section and select the download for Build Tools for Visual Studio 2022.
This will launch the Visual Studio Installer, which will bring up a dialog showing the available Visual Studio Build Tools workloads. Check the Desktop development with C++ workload and select Install.


Note: You can use the C++ toolset from Visual Studio Build Tools along with Visual Studio Code to compile, build, and verify any C++ codebase as long as you also have a valid Visual Studio license (either Community, Pro, or Enterprise) that you are actively using to develop that C++ codebase.
Check your Microsoft Visual C++ installation
To use MSVC from a command line or VS Code, you must run from a Developer Command Prompt for Visual Studio. An ordinary shell such as PowerShell, Bash, or the Windows command prompt does not have the necessary path environment variables set.
To open the Developer Command Prompt for VS, start typing ‘developer’ in the Windows Start menu, and you should see it appear in the list of suggestions. The exact name depends on which version of Visual Studio or the Visual Studio Build Tools you have installed. Select the item to open the prompt.

You can test that you have the C++ compiler, cl.exe, installed correctly by typing ‘cl’ and you should see a copyright message with the version and basic usage description.

If the Developer Command Prompt is using the BuildTools location as the starting directory (you wouldn’t want to put projects there), navigate to your user folder (C:users{your username}) before you start creating new projects.
Note: If for some reason you can’t run VS Code from a Developer Command Prompt, you can find a workaround for building C++ projects with VS Code in Run VS Code outside a Developer Command Prompt.
Create Hello World
From the Developer Command Prompt, create an empty folder called «projects» where you can store all your VS Code projects, then create a subfolder called «helloworld», navigate into it, and open VS Code (code) in that folder (.) by entering the following commands:
mkdir projects
cd projects
mkdir helloworld
cd helloworld
code .
The «code .» command opens VS Code in the current working folder, which becomes your «workspace». As you go through the tutorial, you will see three files created in a .vscode folder in the workspace:
tasks.json(build instructions)launch.json(debugger settings)c_cpp_properties.json(compiler path and IntelliSense settings)
Add a source code file
In the File Explorer title bar, select the New File button and name the file helloworld.cpp.

Add hello world source code
Now paste in this source code:
#include <iostream>
#include <vector>
#include <string>

using namespace std;

int main()
{
    vector<string> msg {"Hello", "C++", "World", "from", "VS Code", "and the C++ extension!"};

    for (const string& word : msg)
    {
        cout << word << " ";
    }
    cout << endl;
}
Now press kb(workbench.action.files.save) to save the file. Notice how the file you just added appears in the File Explorer view (kb(workbench.view.explorer)) in the side bar of VS Code:

You can also enable Auto Save to automatically save your file changes, by checking Auto Save in the main File menu.
The Activity Bar on the far left lets you open different views such as Search, Source Control, and Run. You’ll look at the Run view later in this tutorial. You can find out more about the other views in the VS Code User Interface documentation.
Note: When you save or open a C++ file, you may see a notification from the C/C++ extension about the availability of an Insiders version, which lets you test new features and fixes. You can ignore this notification by selecting the
X(Clear Notification).
Explore IntelliSense
In your new helloworld.cpp file, hover over vector or string to see type information. After the declaration of the msg variable, start typing msg. as you would when calling a member function. You should immediately see a completion list that shows all the member functions, and a window that shows the type information for the msg object:

You can press the kbstyle(Tab) key to insert the selected member; then, when you add the opening parenthesis, you will see information about any arguments that the function requires.
Run helloworld.cpp
Remember, the C++ extension uses the C++ compiler you have installed on your machine to build your program. Make sure you have a C++ compiler installed before attempting to run and debug helloworld.cpp in VS Code.
-
Open
helloworld.cppso that it is the active file. -
Press the play button in the top right corner of the editor.
-
Choose C/C++: cl.exe build and debug active file from the list of detected compilers on your system.

You’ll only be asked to choose a compiler the first time you run helloworld.cpp. This compiler will be set as the «default» compiler in tasks.json file.
-
After the build succeeds, your program’s output will appear in the integrated Terminal.

If you get an error trying to build and debug with cl.exe, make sure you have started VS Code from the Developer Command Prompt for Visual Studio using the code . shortcut.

The first time you run your program, the C++ extension creates tasks.json, which you’ll find in your project’s .vscode folder. tasks.json stores build configurations.
Your new tasks.json file should look similar to the JSON below:
{
"version": "2.0.0",
"tasks": [
    {
        "type": "shell",
        "label": "C/C++: cl.exe build active file",
        "command": "cl.exe",
        "args": [
            "/Zi",
            "/EHsc",
            "/Fe:",
            "${fileDirname}\${fileBasenameNoExtension}.exe",
            "${file}"
        ],
        "problemMatcher": [
            "$msCompile"
        ],
        "group": {
            "kind": "build",
            "isDefault": true
        },
        "detail": "Task generated by Debugger."
    }
]
}
Note: You can learn more about
tasks.jsonvariables in the variables reference.
The command setting specifies the program to run; in this case that is «cl.exe». The args array specifies the command-line arguments that will be passed to cl.exe. These arguments must be specified in the order expected by the compiler.
This task tells the C++ compiler to take the active file (${file}), compile it, and create an executable file (/Fe: switch) in the current directory (${fileDirname}) with the same name as the active file but with the .exe extension (${fileBasenameNoExtension}.exe), resulting in helloworld.exe for our example.
The label value is what you will see in the tasks list; you can name this whatever you like.
The detail value is what you will as the description of the task in the tasks list. It’s highly recommended to rename this value to differentiate it from similar tasks.
The problemMatcher value selects the output parser to use for finding errors and warnings in the compiler output. For cl.exe, you’ll get the best results if you use the $msCompile problem matcher.
From now on, the play button will read from tasks.json to figure out how to build and run your program. You can define multiple build tasks in tasks.json, and whichever task is marked as the default will be used by the play button. In case you need to change the default compiler, you can run Tasks: Configure default build task. Alternatively you can modify the tasks.json file and remove the default by replacing this segment:
    "group": {
        "kind": "build",
        "isDefault": true
    },
with this:
Modifying tasks.json
You can modify your tasks.json to build multiple C++ files by using an argument like "${workspaceFolder}/*.cpp" instead of ${file}.This will build all .cpp files in your current folder. You can also modify the output filename by replacing "${fileDirname}\${fileBasenameNoExtension}.exe" with a hard-coded filename (for example "${workspaceFolder}\myProgram.exe").
Debug helloworld.cpp
- Go back to
helloworld.cppso that it is the active file. - Set a breakpoint by clicking on the editor margin or using F9 on the current line.
- From the drop-down next to the play button, select Debug C/C++ File.
- Choose C/C++: cl.exe build and debug active file from the list of detected compilers on your system (you’ll only be asked to choose a compiler the first time you run/debug
helloworld.cpp).


The play button has two modes: Run C/C++ File and Debug C/C++ File. It will default to the last-used mode. If you see the debug icon in the play button, you can just click the play button to debug, instead of selecting the drop-down menu item.

If you get an error trying to build and debug with cl.exe, make sure you have started VS Code from the Developer Command Prompt for Visual Studio using the code . shortcut.
Explore the debugger
Before you start stepping through the code, let’s take a moment to notice several changes in the user interface:
-
The Integrated Terminal appears at the bottom of the source code editor. In the Debug Output tab, you see output that indicates the debugger is up and running.
-
The editor highlights the line where you set a breakpoint before starting the debugger:
-
The Run and Debug view on the left shows debugging information. You’ll see an example later in the tutorial.
-
At the top of the code editor, a debugging control panel appears. You can move this around the screen by grabbing the dots on the left side.


Step through the code
Now you’re ready to start stepping through the code.
-
Click or press the Step over icon in the debugging control panel.
This will advance program execution to the first line of the for loop, and skip over all the internal function calls within the
vectorandstringclasses that are invoked when themsgvariable is created and initialized. Notice the change in the Variables window on the left.In this case, the errors are expected because, although the variable names for the loop are now visible to the debugger, the statement has not executed yet, so there is nothing to read at this point. The contents of
msgare visible, however, because that statement has completed. -
Press Step over again to advance to the next statement in this program (skipping over all the internal code that is executed to initialize the loop). Now, the Variables window shows information about the loop variables.
-
Press Step over again to execute the
coutstatement. (Note that as of the March 2019 release, the C++ extension does not print any output to the Debug Console until the loop exits.) -
If you like, you can keep pressing Step over until all the words in the vector have been printed to the console. But if you are curious, try pressing the Step Into button to step through source code in the C++ standard library!
To return to your own code, one way is to keep pressing Step over. Another way is to set a breakpoint in your code by switching to the
helloworld.cpptab in the code editor, putting the insertion point somewhere on thecoutstatement inside the loop, and pressingkb(editor.debug.action.toggleBreakpoint). A red dot appears in the gutter on the left to indicate that a breakpoint has been set on this line.Then press
kb(workbench.action.debug.start)to start execution from the current line in the standard library header. Execution will break oncout. If you like, you can presskb(editor.debug.action.toggleBreakpoint)again to toggle off the breakpoint.


Set a watch
Sometimes you might want to keep track of the value of a variable as your program executes. You can do this by setting a watch on the variable.
-
Place the insertion point inside the loop. In the Watch window, select the plus sign and in the text box, type
word, which is the name of the loop variable. Now view the Watch window as you step through the loop. -
Add another watch by adding this statement before the loop:
int i = 0;. Then, inside the loop, add this statement:++i;. Now add a watch forias you did in the previous step. -
To quickly view the value of any variable while execution is paused on a breakpoint, you can hover over it with the mouse pointer.


Customize debugging with launch.json
When you debug with the play button or kb(workbench.action.debug.start), the C++ extension creates a dynamic debug configuration on the fly.
There are cases where you’d want to customize your debug configuration, such as specifying arguments to pass to the program at runtime. You can define custom debug configurations in a launch.json file.
To create launch.json, choose Add Debug Configuration from the play button drop-down menu.

You’ll then see a dropdown for various predefined debugging configurations. Choose C/C++: cl.exe build and debug active file.

VS Code creates a launch.json file, which looks something like this:
{
"version": "0.2.0",
"configurations": [
    {
        "name": "C/C++: cl.exe build and debug active file",
        "type": "cppvsdbg",
        "request": "launch",
        "program": "${fileDirname}\${fileBasenameNoExtension}.exe",
        "args": [],
        "stopAtEntry": false,
        "cwd": "${workspaceFolder}",
        "environment": [],
        "externalConsole": false,
        "preLaunchTask": "C/C++: cl.exe build active file"
    }
]
}
In the JSON above, program specifies the program you want to debug. Here it is set to the active file folder (${fileDirname}) and active filename with the .exe extension (${fileBasenameNoExtension}.exe), which if helloworld.cpp is the active file will be helloworld.exe. The args property is an array of arguments to pass to the program at runtime.
By default, the C++ extension won’t add any breakpoints to your source code and the stopAtEntry value is set to false.
Change the stopAtEntry value to true to cause the debugger to stop on the main method when you start debugging.
From now on, the play button and
kb(workbench.action.debug.start)will read from yourlaunch.jsonfile when launching your program for debugging.
C/C++ configurations
If you want more control over the C/C++ extension, you can create a c_cpp_properties.json file, which will allow you to change settings such as the path to the compiler, include paths, C++ standard (default is C++17), and more.
You can view the C/C++ configuration UI by running the command C/C++: Edit Configurations (UI) from the Command Palette (kb(workbench.action.showCommands)).

This opens the C/C++ Configurations page. When you make changes here, VS Code writes them to a file called c_cpp_properties.json in the .vscode folder.

Visual Studio Code places these settings in .vscodec_cpp_properties.json. If you open that file directly, it should look something like this:
{
"configurations": [
    {
        "name": "Win32",
        "includePath": [
            "${workspaceFolder}/**"
        ],
        "defines": [
            "_DEBUG",
            "UNICODE",
            "_UNICODE"
        ],
        "windowsSdkVersion": "10.0.18362.0",
        "compilerPath": "C:/Program Files (x86)/Microsoft Visual Studio/2019/BuildTools/VC/Tools/MSVC/14.24.28314/bin/Hostx64/x64/cl.exe",
        "cStandard": "c11",
        "cppStandard": "c++17",
        "intelliSenseMode": "msvc-x64"
    }
],
"version": 4
}
You only need to add to the Include path array setting if your program includes header files that are not in your workspace or in the standard library path.
Compiler path
The compilerPath setting is an important setting in your configuration. The extension uses it to infer the path to the C++ standard library header files. When the extension knows where to find those files, it can provide useful features like smart completions and Go to Definition navigation.
The C/C++ extension attempts to populate compilerPath with the default compiler location based on what it finds on your system. The extension looks in several common compiler locations.
The compilerPath search order is:
- First check for the Microsoft Visual C++ compilerOpe
- Then look for g++ on Windows Subsystem for Linux (WSL)
- Then g++ for Mingw-w64.
If you have g++ or WSL installed, you might need to change compilerPath to match the preferred compiler for your project. For Microsoft C++, the path should look something like this, depending on which specific version you have installed: «C:/Program Files (x86)/Microsoft Visual Studio/2017/BuildTools/VC/Tools/MSVC/14.16.27023/bin/Hostx64/x64/cl.exe».
Reusing your C++ configuration
VS Code is now configured to use the Microsoft C++ compiler. The configuration applies to the current workspace. To reuse the configuration, just copy the JSON files to a .vscode folder in a new project folder (workspace) and change the names of the source file(s) and executable as needed.
Run VS Code outside the Developer Command Prompt
In certain circumstances, it isn’t possible to run VS Code from Developer Command Prompt for Visual Studio (for example, in Remote Development through SSH scenarios). In that case, you can automate initialization of Developer Command Prompt for Visual Studio during the build using the following tasks.json configuration:
{
    "version": "2.0.0",
    "windows": {
        "options": {
            "shell": {
                "executable": "cmd.exe",
                "args": [
                    "/C",
                    // The path to VsDevCmd.bat depends on the version of Visual Studio you have installed.
                    ""C:/Program Files (x86)/Microsoft Visual Studio/2019/Community/Common7/Tools/VsDevCmd.bat"",
                    "&&"
                ]
            }
        }
    },
    "tasks": [
        {
            "type": "shell",
            "label": "cl.exe build active file",
            "command": "cl.exe",
            "args": [
                "/Zi",
                "/EHsc",
                "/Fe:",
                "${fileDirname}\${fileBasenameNoExtension}.exe",
                "${file}"
            ],
            "problemMatcher": [
                "$msCompile"
            ],
            "group": {
                "kind": "build",
                "isDefault": true
            }
        }
    ]
}
Note: The path to
VsDevCmd.batmight be different depending on the Visual Studio version or installation path. You can find the path toVsDevCmd.batby opening a Command Prompt and runningdir "VsDevCmd*" /s.
Troubleshooting
The term ‘cl.exe’ is not recognized
If you see the error «The term ‘cl.exe’ is not recognized as the name of a cmdlet, function, script file, or operable program.», this usually means you are running VS Code outside of a Developer Command Prompt for Visual Studio and VS Code doesn’t know the path to the cl.exe compiler.
VS Code must either be started from the Developer Command Prompt for Visual Studio, or the task must be configured to run outside a Developer Command Prompt.
You can always check that you are running VS Code in the context of the Developer Command Prompt by opening a new Terminal (kb(workbench.action.terminal.new)) and typing ‘cl’ to verify cl.exe is available to VS Code.
fatal error C1034: assert.h: no include path set
In this case, cl.exe is available to VS Code through the PATH environment variable, but VS Code still needs to either be started from the Developer Command Prompt for Visual Studio, or be configured to run outside the Developer Command Prompt. Otherwise, cl.exe does not have access to important environment variables such as INCLUDE.
Next steps
- Explore the VS Code User Guide.
- Review the Overview of the C++ extension.
- Create a new workspace, copy your
.vscodeJSON files to it, adjust the necessary settings for the new workspace path, program name, and so on, and start coding!
In previous post, I have explained how you can create Hello World Program in C# using Visual Studio, and have also explained it in First C# Hello World program of tutorial, so in this post I am going to provide you details of creating C# Hello World program using Visual Studio Code, light weighted IDE.
Visual Studio Code, is a great and lightweight code Editor, which has simple and easy interface. Although it doesn’t have too many tools like bigger IDE (Visual Studio, Eclipse, PyCharm etc), it can still be useful by using it various extensions. If you haven’t downloaded Visual Studio Code yet, you can download it from here: https://code.visualstudio.com/download
Once you have downloaded and installed the above set up, you need to follow below steps.
1.Install C# Extension
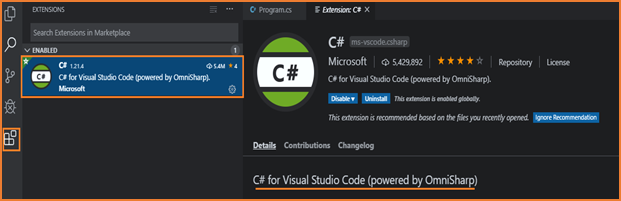
After installing VS Code, open it and Navigate to «View»-> «Extension»
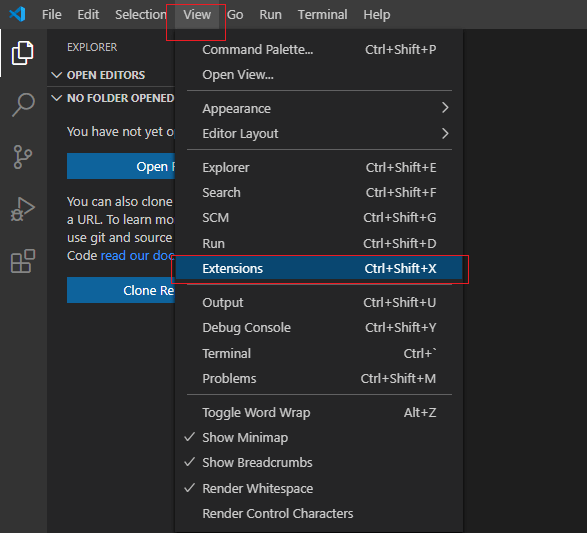
Now Serach for «C#» and select the «C#» Extension, click on «Install» button, as shown in the below image
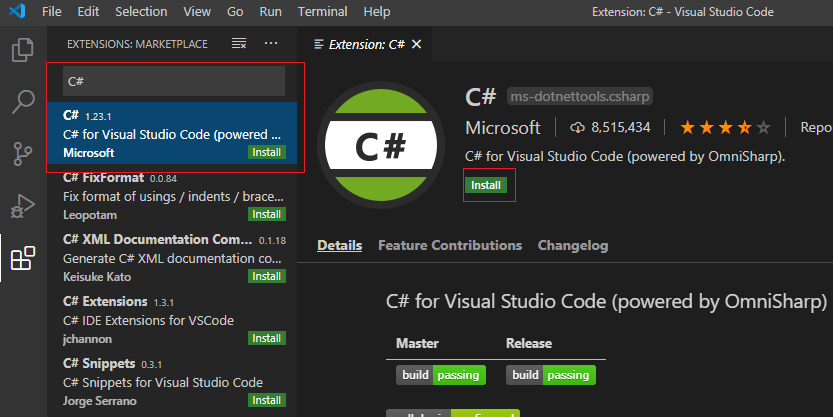
It would be helpful if you install few more plugins with the above one, repeating same procedure, you must install these extensions also
- C# FixFormat
- C# Extensions
- Code runner
Once you have installed all these Extensions, head to next step.
2. Download and Install .NET Core (Skip this if you have already installed it)
We still need .NET Core in our system so click «here», you can download .NET Core SDK based on your system ( Windows, Linux or Mac) and then Install the SDK, once the installation is finished you will see output similar to below
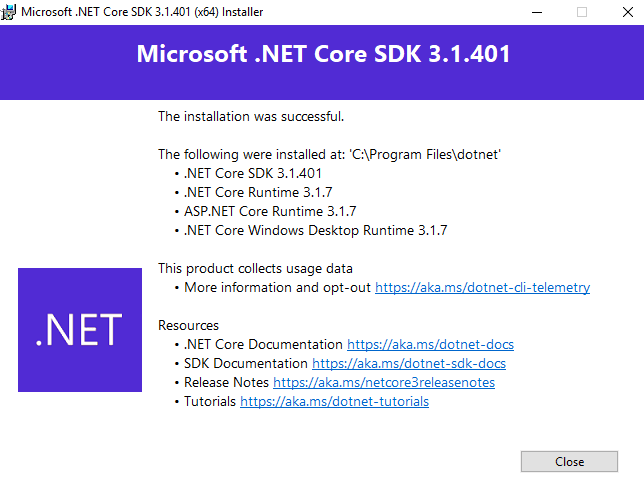
In the above image, I have installed .NET Core 3.1, but you can download latest .NET Core like 6 or 7.
3. Create new C# project and run
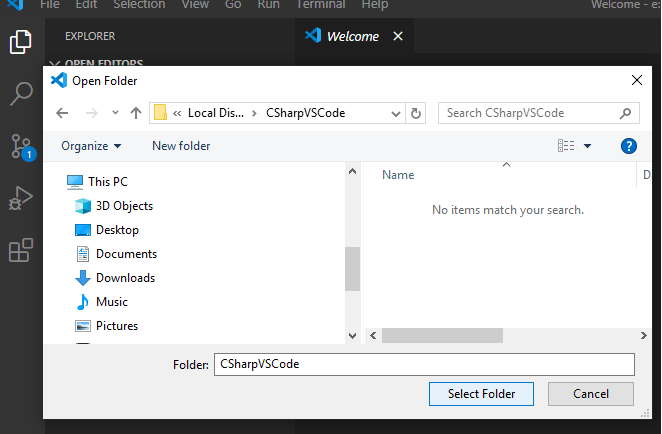
Now, we need to create new C# project,so create a new folder on «Dekstop» or on C: or anywhere else on your PC, basically wherever you prefer. I will create it inside «E:» as «CSharpVSCode»
Now open VS Code, navigate to «File»-> «Open Folder», open the folder which we have just created above.
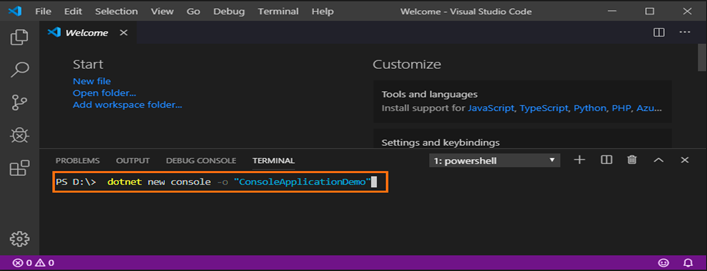
Now, Select «Terminal»-> «New terminal» and then run command «dotnet new console» (remeber to select «powershell» as your default shell before running this command)
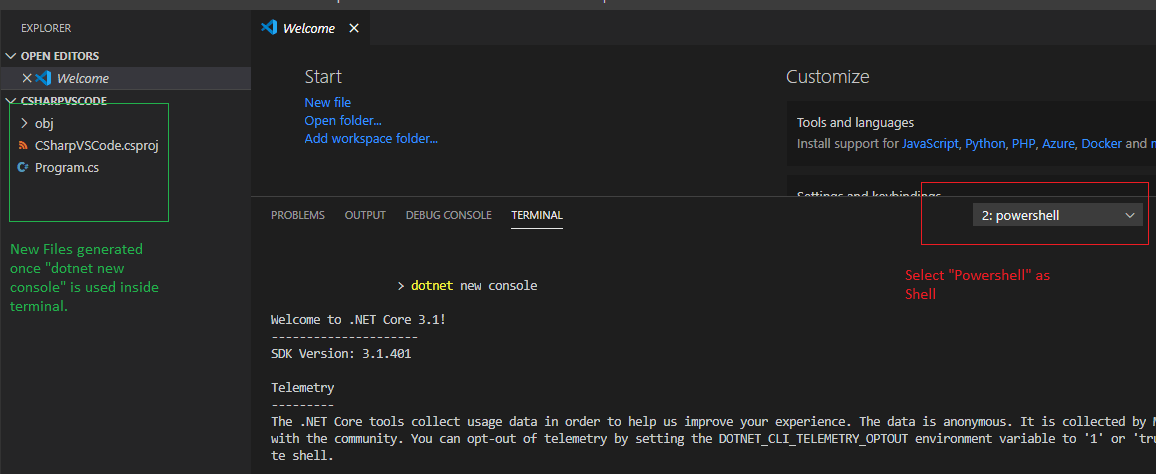
Once the command is executed successfully, you will see new files were generated.
Select and click on «Program.cs» to open it, once you will open it, VS Code might ask you to install «C#» Extension if not correctly installed and enabled on Step 1, then install it.
Once everything is done, you will see output like below
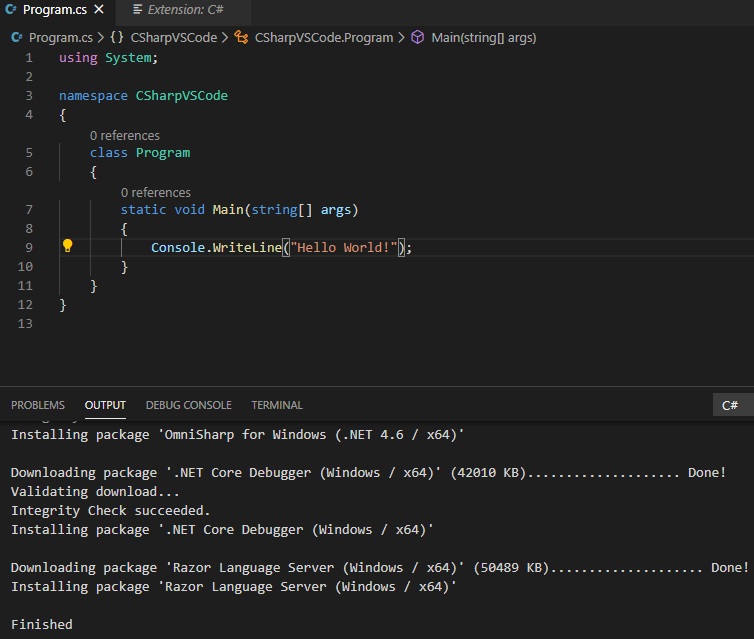
That’s it, we are done.
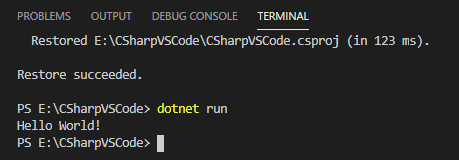
Now we just need to compile the above code and get the output.
So, if you want to run and compile the above code, you can simply type «dotnet run» in the terminal to see the output
If you are new C# and want’s to understand the code, here is the code explanation, which we have explained here
- namespace: Namespace is a collection of collection of classes and sub namespaces. These sub namespaces are also namespaces in their own scope, but may have to be referenced using the parent namespace.
- class: it’s a keyword which is used to define class. A class is a piece of code that defines how a class of objects should behave, and what properties they can have.
- static: It is a keyword which is used to declare the class variable. We don’t need to create object to access static variable.
- void: void is a return type of the main method.
- Main: Method is a logical representation of a behavior. Methods can be used to create functionalities for a class. A method can have a scope, the type of data it returns, a name to be referenced from other code, list of arguments that it can take.
Main is the method name, in console application , main method is the method which is required and runs/executes first. - string[] args: It is string array which is used to store the command line arguments. Writing this is optional.
- Console.WriteLine(“Hello World”): WriteLine is the method used for writing on the console application. In this code line, we print the «Hello World» string to the console. To print a message to the console, we use the
WriteLine()method of the Console class. The class represents the standard input, output, and error streams for console applications. Note that Console class is part of the System namespace. This line was the reason to import the namespace with theusing System;statement. If we didn’t use the statement, we would have to use the fully qualified name of theWriteLine()method:System.Console.WriteLine("Hello World");. - Using system: These are usually called as Imports, we are importing just one namespace here «System», We can import other namespaces and use them in our program, but here only «System» namespace is required, because of Console.WriteLine method.
Although you can see we can easily create a new console application in Visual Studio code and even create .NET Core based web-application, I will recommend any beginner or advanced developer to use Visual Studio IDE for C# or .NET related projects, as it is more powerful and with Visual Sutio extensions, it makes development easier in C#.
To Continue learning C#, you can check the Complete C# Tutorial
You may also like to read:
C# Console Writeline and Write
Best HTML Editors for developers
Best IDE for Web Development (C#, ASP.NET, Java , PHP, HTML, Javascript)
C# Variables
C# Data type
How to debug in visual studio? ( Tutorial to debug C# code )
Visual Studio Code (or VSCode at it usually known) has become one of the most widely used IDEs, and not by mistake. The interface is simple and very fast. Although it doesn’t have all of the goodies that come with “bigger” IDEs (Eclipse, PyCharm, Visual Studio), it has many extensions that fill parts of this gap. You can download VSCode here.
The best way to get started with a new IDE is by creating a simple project, and as usual, it will be “hello world”. Let’s do this step by step. You will be needing the .NET core SDK, which you can download here (make sure to download the SDK and not the runtime). I’m using Windows 10, VSCode 1.44.2 and .NET core 3.1 for this project.
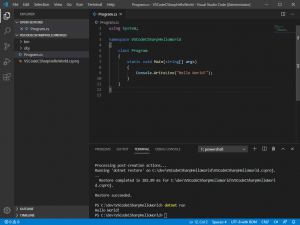
Let’s open up VScode. This is the screen that pops up:

To start, open a folder which will be the location where we write the program. I’ll put mine in c:devVSCodeCSharpHelloWorld. The window changes a bit and we are now looking at the contents of the folder. We’ll be using the built-in terminal, so open it up by clicking Ctrl+` or through the menu “View->Terminal”. It should look something like this:

Unlike other IDEs, there is no built-in concept of a solution or project. There is something called a “Workspace” that allows us to work with multiple folders at a time, but that is for more advanced projects.
To create a new console application, navigate to the console, and write:
> dotnet new console
This creates a project file with the name of your directory, and a C# file called Program.cs that contains the code of the program. Now let’s run the program we have just created. Type in the console
> dotnet run
You should see the text “Hello World!” written in the terminal.
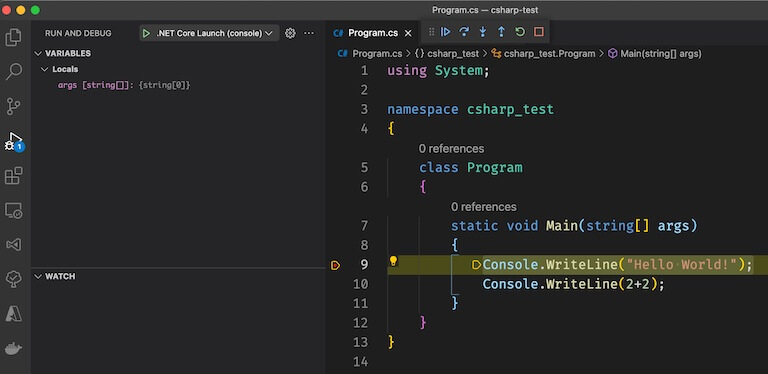
Now let’s change the program to do a bit more, asking for your name and then writing “Hello <Your Name>”. Open the Program.cs file by double-clicking it. Your editor should look like this:
Now insert a new line above Console.WriteLine and type Console.. At this step, you would expect some kind of code complete/suggest to kick-in. But no! Code complete/suggest does not come bundled into VSCode (that is one reason it is so lean), but it is easy to add. Go to the “Extensions” view by clicking on the fifth icon on the left (or “View->Extensions”). You will be shown a long list of extensions that are available to install. For now, we just need the “C#” extension, so click on the “install” button right next to it.

After the extension is installed (no need to reopen the app, not to say reboot the computer!), navigate back to the “Program.cs” file, and write again Console.. Voila! The properties and methods of the class are shown. Continuing from where we left, add two lines to the main method, making it look like this:
static void Main(string[] args)
{
    Console.WriteLine("What is your name?");
    var name = Console.ReadLine();
    Console.WriteLine($"Hello {name}!");
}
Enter dotnet run again in the terminal. The program will ask for your name, write it and hit enter:

Awesome!
Lately, I’m working almost every day with VSCode, in parallel to both PyCharm and Visual Studio Enterprise and I enjoy it a lot. I still have the other IDEs open sometimes because not all the functionality in them exists in VSCode but with each release (and they move quite fast) it is getting better and better, without getting slower and bulky. Great job VSCode team!
I have more ideas for VSCode tutorials and with some time I’ll get to them soon. If you have a good one, leave a comment and I’ll add it to my list.
Until next time, happy coding!
- .net
- C#
- csharp
- developer
- dotnet
- Microsoft
- programming
- software
- tutorial
- visual studio code
- vscode
While many developers use Visual Studio for C# development, I still use VSCode. In this post, I’ll show you how to run C# in VSCode, as well as create a project, execute the code, debug, and compile it.
Quick Nav
- How to Run C# in VSCode
- 1. Install .NET 5.0
- 2. Create a new C# project in VSCode
- 3. Run Your C# Code in VSCode
- 4. Debug Your C# Code in VSCode
- 5. Compile Your C# Code in VSCode
- Conclusion
As stated above, I make it a point to use VSCode for as many things as I can get away with.
I feel comfortable in VSCode, know the shortcuts, and just don’t like jumping editors.
I started out with C# in Visual Studio because I was told to. It’s easy, has many, many features, and is what the tutorials told me to use.
Later, I made it a point to become efficient in it with VSCode. I was using it for everything else. Why not with C#? Visual Studio, to me, is just too bulky and has too much going on.
So in this post, I want to help you do the same.
Whether you are just starting out in C# or have decided to switch from Visual Studio to VSCode, I’m going to share with you how to run, debug, execute, and compile your C# code in VSCode.
Watch the Video?
Before we get started, if you prefer video format, check out the tutorial on YouTube.
Otherwise, continue reading.
How to Run C# in VSCode
1. Install .NET 5.0
First, install .NET 5.0. You can do that here:
https://dotnet.microsoft.com/download
Then confirm that dotnet is installed by checking the version in a terminal window:
dotnet --version
# 5.0.202 (or whatever version yours is)
Also go ahead and install this C# VSCode extension.
2. Create a new C# project in VSCode
Next, create a new project and open it in VSCode:
dotnet new console -o app
cd app
code . # to open project in VSCode
Now you should see a simple Hello World app with the main code in Program.cs
3. Run Your C# Code in VSCode
To execute your code, simply run:
…and you should see Hello World displayed in the console.
4. Debug Your C# Code in VSCode
First, be sure you installed the official C# extension mentioned above. If not, it can be found here.
Next, in VSCode open the Command Palette by going to View > Command Palette (or use the shortcut if you know what it is), and search for .NET: Generate Assets for Build and Debug
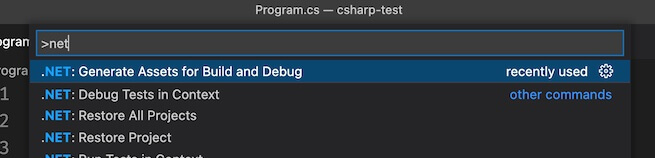
Choosing this will generate a .vscode folder with a prepopulated build configuration in it.
Now go to the “Run and Debug” tab in VSCode, set your breakpoint(s), and click the Play button to debug.
5. Compile Your Code
To compile your code, run:
After that is done you will have an executable (exe or dll) in your /bin folder. Depending on your build configuration it may be in a Debug folder or a Release folder.
Conclusion
And that’s how you run C# code in VSCode.
Now build our your code, debug it as needed, run dotnet run to execute your code, and dotnet build to compile it.
Rinse and repeat.
Let me know below if you have any questions.
Introduction
In this article, we explore the Visual Studio Code is a free code editor developed by Microsoft for Windows, Linux, and macOS. We create the C# Console application in Vs code with the help of .NET Core.
Visual Studio Code (Vs Code) is optimized for cross-platform .NET Core development. Visual Studio Code is a lightweight but powerful source code editor which runs on your desktop and is available for Windows, macOS, and Linux.
Use Visual Studio Code with the C# extension to get a powerful editing experience with full support for C# IntelliSense and debugging.
Prerequisites
- Install Visual Studio Code.
- Install the .NET Core SDK.
Objective
Let’s get started with a simple «Console demo application» program on .NET Core,
Create Console Application
Follow the below steps to create the console application,
Steps
- Open a project -> Open Visual Studio Code.
- Open the Integrated Terminal from Visual Studio Code selecting
- Terminal > New Terminal from the sub menu.
- The dotnet command creates a new application of type console for you. The -o parameter creates a directory named ConsoleApplicationDemo where your app is stored and populates it with the required files. The cd ConsoleApllicationDemo command
puts you into the newly created app directory.
- Switch the path to the folder ConsoleApplicationdemo using the below command.
- D:> cd ConsoleApplicationdemo
- Enter the below command to open the ConsoleApplication project in VS Code
- D:ConsoleApplicationdemo> code.
- Repeated Step 3 for opening the terminal command prompt.
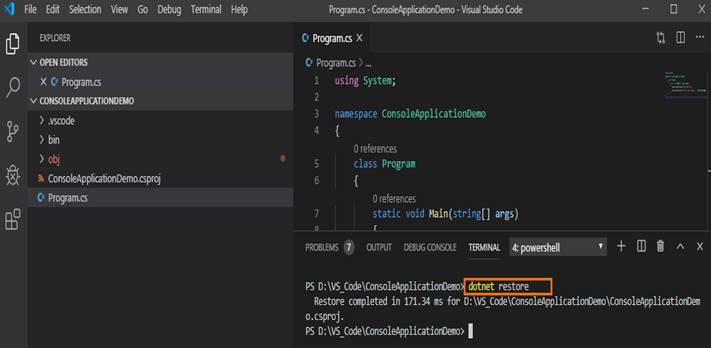
- Run dotnet restore command to resolve the dependencies of the project and give you access to the required .NET Core packages that are needed to build your project

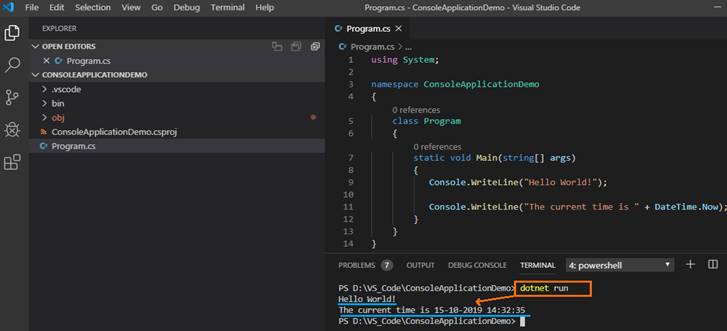
- Type the following command: dotnet run. Run the console application and the below screen output appears.
Debugging
One of the key features of VS Code is its great debugging support. VS Code’s built-in debugger helps accelerate your edit, compile and debug loop.
Follow the below steps for the C# debugger,
Steps
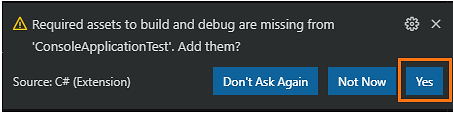
- The first time you open a C# Program.cs file in Visual Studio Code the below pop window appears
- Visual Studio Code should prompt you to add the missing assets to build and debug your app. Select Yes.
- Start the install OmniSharp loads in the editor.
- After completion the below message shows in the command window
- VS Code left Navigation — click on Debugger Icon
- Locate the green
arrow at the top of the pane. Make sure the drop-down next to it has .NET Core Launch
(console) selected. - Add a breakpoint to your project by clicking on the editor margin
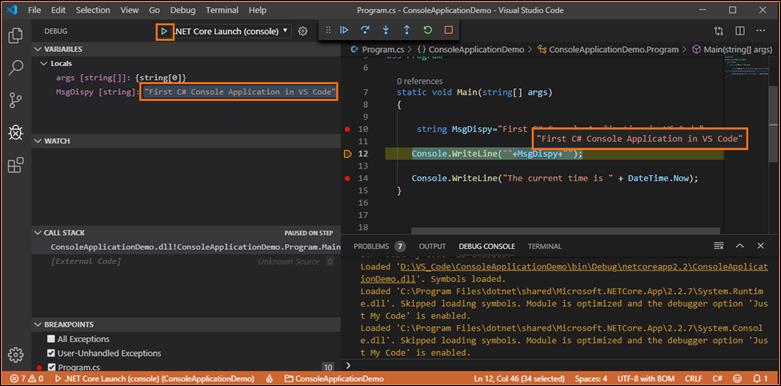
- To start debugging, press F5 or select the green arrow
- Show the local variable value in the top left pane.

 green
green Launch
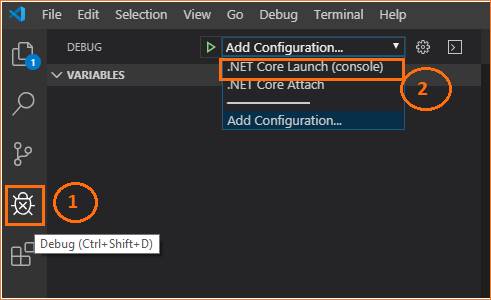

Top Extensions
In the VS code there are more debugging extensions for debugging other languages and runtimes (including PHP, C#, Python, C++, PowerShell and many
others), look for Debuggers extensions in our VS Code Marketplace or
select Install Additional Debuggers in the top-level Debug menu.
Статья открывает цикл уроков, посвященный языку программирования C# и платформе .NET. В этом уроке будет рассмотрен вопрос установки .NET, познакомимся со средами разработки для языка C# и создадим “Hello, World!”-проект.
- Платформа .NET и язык C#
- Версии .NET
- Установка .NET
- .NET Framework
- .NET Core
- Установка для Windows
- Установка на Linux
- Среда разработки (IDE)
- Microsoft Visual Studio
- VS Code
- JetBrains Rider
- Онлайн интерпретаторы
- “Hello, World” на C#
- Создание проекта в Microsoft Visual Studio (Windows)
- Создание проекта с использованием средств .NET Core (Windows и Linux)
- Компиляция файла с исходным кодом вручную (Windows)
Платформа .NET и язык C#
.NET является программной платформой, разработанной компанией Microsoft. Выделим некоторые из ее особенностей:
- Мультиязыковая ориентированность. Основным языком программирования для .NET является C#, помимо него платформа поддерживает еще ряд языков: VB.NET, F#, C++ и др. Эта возможно благодаря тому, что в основе платформы лежит общеязыковая среда исполнения Common Language Runtime (CLR). Код на любом из поддерживаемых языков компилируется в сборку на языке CIL (Common Intermediate Language) – аналог ассемблера для .NET, что позволяет разрабатывать отдельные части приложения на разных языках.
- Кроссплатформенность. Еще одной особенностью платформы является поддержка большинства современных ОС (Windows, MacOS, Linux). Это позволяет заниматься разработкой приложений на языке C# на той ОС которая вам ближе, а запускать их можно на разных ОС и архитектурах.
- Обширная библиотека классов. Платформа включает в себя большое количество библиотек классов. Все они доступны для любого поддерживаемого языка. Внутри библиотек можно найти готовые инструменты для решения широкого круга задач.
- Широкий спектр решений для создания приложений. В рамках платформы .NET разработчик получает доступ к большому количеству инструментов для решения различных задач: ADO.NET и Entity Framework для работы с базами данных, WPF и UWP для разработки десктопных графических приложений, ASP.NET для разработки веб-приложений, Blazor для frontend разработки и т.д.
На текущий момент язык программирования С# – это отличный инструмент для решения практически любых задач. Он является объектно-ориентированным, синтаксически похож на C++ и Java. По данным рейтинга TIOBE Index C# занимает пятое место на момент написания статьи (2020).
Версии .NET
Первая версия платформы называлась .NET Framework, она была представлена в 2002 году. Долгое время она существовала преимущественно для операционной системы Windows. В 2016 году Microsoft выпустила полностью кроссплатформенную среду .NET Core с открытым исходным кодом для разработки ПО под операционные системы Windows, Linux и MacOS. В этом временном промежутке было несколько попыток создать кроссплатформенную версию .NET, среди проектов, которые получили популярность можно отметить Mono от компании Xamarin (ранее Novell). Проект был представлен в 2004, неплохо развивался, и в 2016 году Microsoft купила Xamarin. Xamarin SDK была добавлена в IDE Visual Studio как бесплатный инструмент.
На текущий момент мы находимся на пороге нового витка развития .NET – это появление .NET 5. Это важный этап развития платформы, начиная с которого .NET станет полностью открытой кроссплатформенной средой для всех популярных ОС, больше не будет отдельной версии .NET Framework для Windows и открытой .NET Core, .NET 5 включит в себя все наработки, которые были сделаны за это долгое время. О том, как она выглядит структурно можете посмотреть на картинке ниже.

(Изображение взято с блога Microsoft)
Установка .NET
.NET Framework
.NET Framework используется в Windows и входит в состав ОС начиная с Windows 7, более ранние версии .NET Framework необходимо было самостоятельно устанавливать перед началом разработки. На текущий момент самая новая версия: .NET Framework 4.8. Для того чтобы начать разработку под эту платформу необходимо установить среду Microsoft Visual Studio, о том, как это сделать читайте далее.
.NET Core
Для разработки приложений под .NET Core необходимо скачать соответствующий дистрибутив и установить его. Перейдя по ссылке https://dotnet.microsoft.com/download/dotnet-core вы увидите все версии .NET Core. На момент написания статьи стабильная и рекомендуемая версия – 3.1. На ее примере мы и произведем знакомство с процессом установки.
Выберите в таблице – .NET Core 3.1

В следующем окне вы увидите разные релизы платформы, нас интересует самый верхний. В строке нужного релиза найдите раздел Build apps – SDK.

В зависимости от ОС, под которой вы будете разрабатывать, нажмите на соответствующую ссылку для скачивания дистрибутива.

Установка для Windows
Выберете дистрибутив под Windows и дождидесь его скачивания. После запуска файла установки, на первом экране вы увидите краткую информацию о продукте. Нажмите на кнопку “Установить”.

Начнется установка компонентов платформы .NET Core. Если все пройдет успешно, то в конце этого процесса будет представлен отчет об установке.

На этом процесс установки для Windows можно считать завершенным.
Установка .NET на Linux
Перейдите на страницу официальной документации Microsoft по установке .NET Core и убедитесь, что ваша операционная система (тип и версия) поддерживает возможность установки .NET Core.
Далее рассмотрим пример для Ubuntu. Перейдите в соответствующий раздел документации, нас интересует Ubuntu 20.03 и .NET Core 3.1.
Согласно приведенной инструкции нужно выполнить несколько шагов. Добавьте ключ подписывания пакета Microsoft в список доверенных ключей и добавьте репозиторий пакетов:
> wget https://packages.microsoft.com/config/ubuntu/20.04/packages-microsoft-prod.deb -O packages-microsoft-prod.deb

> sudo dpkg -i packages-microsoft-prod.deb
После этого запустите установку SDK:
> sudo apt-get update;
sudo apt-get install -y apt-transport-https &&
sudo apt-get update &&
sudo apt-get install -y dotnet-sdk-3.1
Для проверки того, что .NET Core установлен на вашей Linux машине можете проверить версии пакета SDK:
> dotnet --list-sdks
3.1.202 [/usr/share/dotnet/sdk]
И проверить версии среды выполнения:
> dotnet --list-runtimes
Microsoft.AspNetCore.App 3.1.4 [/usr/share/dotnet/shared/Microsoft.AspNetCore.App]
Microsoft.NETCore.App 3.1.4 [/usr/share/dotnet/shared/Microsoft.NETCore.App]
Среда разработки (IDE)
Средство разработки, которое включает в себя мощный редактор кода и набор инструментов для работы с проектом, его сборки и т.п. называется IDE. На данный момент существует несколько IDE, в которых есть все необходимое для того чтобы начать путь разработчика на C#, далее будут рассмотрены процессы установки Microsoft Visual Studio, VS Code, JetBrains Rider на ОС Windows.
Microsoft Visual Studio
Если ваша основная ОС это Windows, то одним из самых мощных и удобных средств для разработки приложений под эту платформу является Visual Studio. Это полнофункциональная среда позволяет разрабатывать все типы приложений под Windows, Android, iOS, Linux, веб-сервисы и облачные приложения, поддерживает как .NET Framework так и .NET Core. На момент написания статьи самая актуальная версия этого продукта – это Visual Studio 2019, она имеет ряд лицензий – Community, Professional, Enterprise. Для начинающего разработчика Community варианта будет более чем достаточно, эта лицензия позволяет разрабатывать даже коммерческое ПО, но у нее есть некоторые ограничения, более подробная информация по этому вопросу есть на официальном сайте Microsoft.
Для загрузки Visual Studio перейдите по ссылке https://visualstudio.microsoft.com/ru/downloads/. Нажмите кнопку “Скачать бесплатно” под редакцией Community.

Сохраните файл установки на компьютере. Это веб-установщик, поэтому он имеет небольшой размер. Запустите его, в результате вам будет представлено окно приветствия.

Нажмите на кнопку “Продолжить” дождитесь окончания подготовительного этапа. После этого откроется окно с настройкой компонентов, для выполнения всех работ по курсу достаточно выбрать “Разработка классических приложений .NET”, “ASP.NET и Разработка веб-приложений”.

Дождитесь окончания установки, это может занять продолжительное время в зависимости от мощности вашего компьютера и скорости доступа в интернет.

Microsoft VS Code
Еще один продукт от Microsoft, он позиционируется как легковесный редактор кода, включает в себя отладчик, инструменты для работы с Git, подсветку синтаксиса, IntelliSense, средства для рефакторинга и многое другое. VS Code предоставляет большое количество настроек визуального оформления редактора.
Для его установки перейдите по ссылке https://code.visualstudio.com/?wt.mc_id=vscom_downloads.
Нажмите на кнопку “Download for Windows” и сохраните дистрибутив на свой компьютер.

Запустите скачанный файл. Нажмите “Далее” в окне с лицензионным соглашением.

В следующем окне оставьте все галочки без изменений и нажмите “Далее”.

В последнем окне нажмите кнопку “Установить” и дождитесь окончания установки.

Установка завершена.

JetBrains Rider
Познакомимся еще с одной IDE теперь от другого разработчика – JetBrains. Rider это кроссплатформенная интегрированная среда разработки ПО для платформы .NET. Для ее скачивания перейдите по следующей ссылке https://www.jetbrains.com/ru-ru/rider/download/#section=windows

Нажмите кнопку “Скачать”, дождитесь загрузки дистрибутива и запустите его.

Нажмите “Next” и выберите место установки. На следующем экране можно произвести дополнительные настройки ассоциации файлов или оставить все как есть, после этого нажмите кнопку “Next”, а затем “Install”.

Дождитесь окончания установки.

Онлайн интерпретаторы
Если вы хотите быстро проверить работу вашего кода, то лучше всего для этого подойдет онлайн интерпретатор C#. Далее приведены несколько проектов, которые можно использовать для этой цели:
https://www.onlinegdb.com/online_csharp_compiler
https://repl.it/languages/csharp
https://ideone.com/
https://www.jdoodle.com/compile-c-sharp-online/
“Hello, World” на C#
Создание проекта в Microsoft Visual Studio (Windows)
Создадим первый проект на языке C# для Windows. Для этого запустите Visual Studio, при первом запуске появится окно “Добро пожаловать”.

Снимите галочку “Проверка подлинности …”, если у вас есть Microsoft-аккаунт, то нажмите на кнопку “Войти”, если нет, то на надпись “Не сейчас, возможно позже”.
Далее выберите тему по вкусу и нажмите “Запуск Visual Studio”.

Все подготовительные шаги пройдены, нажмите на кнопку “Создание проекта”.

Выберете шаблон “Консольное приложение” и нажмите “Далее”.

Укажите имя проекта, например “MyFirstProject” и место где он будет сохранен.

В результате будет открыто окно Visual Studio с созданным проектом.
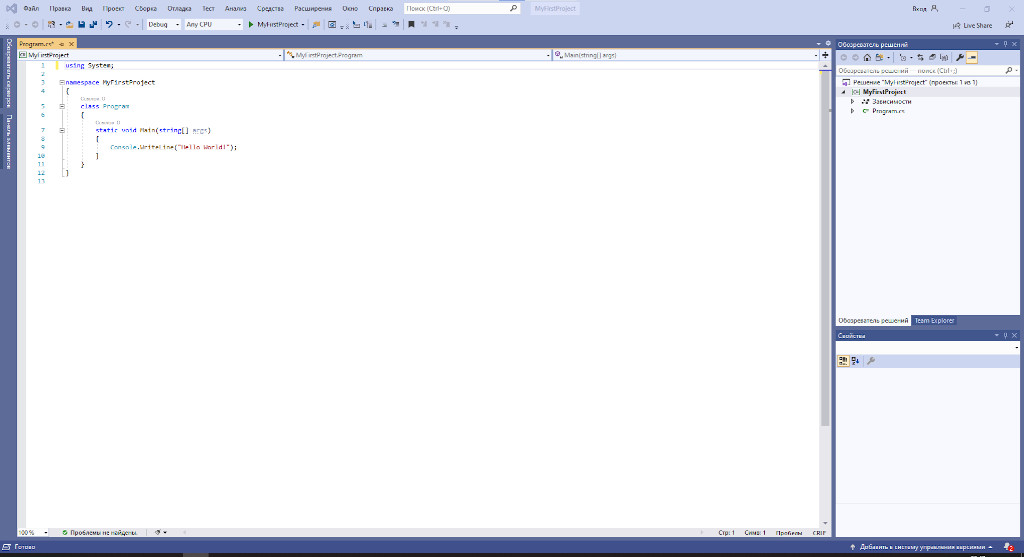
Проект в Visual Studio представляет собой набор файлов, их структура представлена в окне “Обозреватель решения”. Основной файл, который нас сейчас интересует это Program.cs. Откройте его, мы добавили поясняющие комментарии в код модуля:
using System; // Подключаем библиотеку System

// Пространство имен, с классом Program
namespace MyFirstProject
{
    // Объявление класса Program
    class Program
    {
        // Точка входа. Метод, который будет запущен первым при старте приложения
        static void Main(string[] args)
        {
            // Вывод текста "Hello World!" в консоль
            Console.WriteLine("Hello World!");
        }
    }
}
Запустим наше приложение и посмотрим, что произойдет.
Для этого можно использовать несколько способов:
- На панели вверху нажать кнопку с изображением зеленого треугольника. Название у кнопки будет такое же как у вашего “решения”.
- Нажать сочетание клавиш Ctrl + F5, запустится “решение” без отладки, либо F5 для режима отладки.
- Через панель меню: Отладка -> “Запуск без отладки”
Запустите приложение любым вышеописанным способом, в результате появится консоль, в которой будет выведено сообщение “Hello World!“.

Процесс запуска приложения “под капотом” достаточно сложен, он включает в себя создание ряда каталогов, компиляцию проекта в сборку (файл с расширением .exe) и непосредственно запуск получившегося файла. Результат сборки вы можете найти в папке <Папка проекта>binDebug – если выбран режим сборки Debug, либо в <Папка проекта>binRelease – если выбран Release. Режим по умолчанию – это Debug.
Создание проекта с использованием средств .NET Core (Windows и Linux)
В этом разделе мы познакомимся с консольным инструментом .NET Core для создания, сборки и запуска проектов. Приведенный подход работает в Windows и Linux. Перейдите в каталог, в котором вы хотите работать с вашим проектом. Откройте консоль (если вы работаете в Windows, то нажмите сочетание клавиш Win+R и введите cmd), и с помощью команды cd перейдите в папку с проектом:
> cd c:MyFirstProject
Для создания проекта в .NET Core используется команда dotnet new, после которой указывается тип проекта. Так как мы будем работать с консольным приложением, то нужно указать тип console:
> dotnet new console
После выполнения команды в папке с проектом будет размещен необходимый набор файлов. Для запуска проекта воспользуйтесь командой:
> dotnet run
Как и в случае с проектом в Visual Studio, в консоли будет выведен текст “Hello World!”.
Поработаем над кодом программы: вместо текста выведем текущую дату. Для этого в файле Program.cs замените строку
Console.WriteLine(“Hello World!”);
на
Console.WriteLine(DateTime.Now);
Сохраните файл и выполните команду:
> dotnet run
Вместо текста в консоли должна появиться текущая дата.
Компиляция файла с исходным кодом вручную (Windows)
Познакомимся с компилятором C#, из .NET Framework (только для Windows). Создайте пустой каталог, а в нем файл Program.cs. Откройте его текстовым редактором и внесите туда следующий код:
using System;

namespace FirstApp
{
    class Program
    {
        static void Main(string[] args)
        {
            Console.WriteLine(DateTime.Now);
        }
    }
}
В меню “Пуск” найдите и откройте “Developer Command Prompt for VS 2019”, перейдите в каталог с файлом и выполните в нем команду:
> csc.exe Program.cs
Если компиляция прошла успешно, то должен появиться файл Program.exe. Запустите его для этого введите в терминале:
> Program.exe
В результате должны быть выведены текущие дата и время.