#Трейдинг #Обзоры
Pine представляет собой скриптовый язык для TradingView. Он позволяет пользователям торговых графиков самостоятельно создавать индикаторы или стратегии. Pine легок и похож на Python, а его задача состоит в том, чтобы позволить писать скрипты с минимальным числом строк кода. Мы узнаем, кому подходит Pine Script, а в каких случаях использовать его не стоит. Познакомимся с альтернативами скриптам от TradingView. Рассмотрим разные примеры использования Pine в новой, 5-й версии: создание SMA, установка стоп-лоссов, заключение сделок и многое другое.
-
Что такое скрипт Pine? -
Почему я должен использовать скрипт Pine? -
Почему я не должен использовать скрипт Pine? -
Какие есть альтернативы использованию скрипта Pine? -
Как начать работу со скриптом Pine? -
-
Первый взгляд на редактор Pine
-
-
Как узнать цену Apple? -
Как получить SMA ( 20 ) Apple? -
Как протестировать кросс-стратегию скользящих средних с помощью Pine Script? -
Как установить тейк-профит и стоп-лосс? -
Как запустить сделку с Apple, когда Google движется на 5%? -
Как модифицировать наши скрипты без кодирования? -
Как построить сценарий с помощью Pine? -
-
График работы рынка Форекс -
Нанесение аннотаций
-
-
Как я могу создать собственный индикатор в скрипте Pine? -
Последние мысли
Pine Script — это язык программирования, созданный TradingView для тестирования торговых стратегий и создания пользовательских индикаторов.
Скрипт Pine разработан, чтобы быть легким, и в большинстве случаев вы можете достичь своих целей с меньшим количеством строк кода по сравнению с другими языками программирования.
Он не основан на каком-либо конкретном языке, но если вы использовали Python, то быстро разберетесь и заметите сходство.
Код скрипта Pine можно писать в редакторе Pine, который является частью платформы онлайн-графиков TradingView.
Почему я должен использовать скрипт Pine?
Встроенные данные — это одна из важных причин. Тестирование стратегий или создание индикаторов на других языках требует поиска вами собственных данных. Это не только означает, что вам нужно найти место, откуда можно взять данные, но вам также придется отформатировать их определенным образом, и весь этот процесс может занять много времени. TradingView имеет множество готовых данных, доступных всего одной строкой кода.
Простота в освоении — синтаксис скрипта Pine удобочитаем и проще, чем в других языках программирования. Кроме того, вам не нужно тратить много времени на проверку и обработку ошибок, поскольку TradingView позаботится обо всем этом за вас.
Обширная пользовательская база и библиотека. Пользователи TradingView могут публиковать свои индикаторы и стратегии в библиотеке TradingView.
Доступ к открытому исходному коду — отличный способ учиться у других программистов. Кроме того, в некоторых случаях кто-то другой уже написал код для того, что вам нужно.
Почему я не должен использовать скрипт Pine?
Основная причина, по которой вы не захотите использовать скрипт Pine, заключается в том, что вы ограничены вселенной TradingView.
Вот некоторые конкретные ограничения:
Данные. Если TradingView не предлагает нужные вам данные, вам не повезло. Конечно, TradingView имеет очень обширную базу данных. Но если ваша стратегия предполагает торговлю на малоизвестных рынках, данные о ценах могут быть недоступны.
Сервис выходит за рамки данных о ценах. Некоторые стратегии включают экономические или статистические данные. TradingView предлагает некоторые данные (в основном данные Quandl) в этой категории, но в настоящее время они ограничены.
Если вы используете альтернативные данные в своей стратегии, вероятно, будет проще использовать другой язык программирования, который обеспечивает большую гибкость.
Внешние библиотеки. Pine Script не подходит, если вы хотите использовать внешние библиотеки для выполнения таких задач, как машинное обучение. Есть лучшие альтернативы, если ваша стратегия основана на использовании науки о данных или других сторонних библиотек.
Торговля парами – руководство из реальной жизни
Какие есть альтернативы использованию скрипта Pine?
Thinkorswim от TD Ameritrade — эта платформа во многом похожа на Pine Script.
Она использует проприетарный язык thinkScript и хранит данные о ценах в массивах аналогично скрипту Pine. Данные встроены, и платформа предназначена для создания пользовательских индикаторов и стратегий.
Ninjatrader — эта платформа также использует собственный язык, который называется Ninjascript. Язык не является полностью проприетарным, поскольку основан на C#.
Ninjatrader обладает большей гибкостью, поскольку позволяет подключаться к пользовательским потокам данных. Если вы уже знакомы с C#, C или C++, это может оказаться подходящей альтернативой.
Как начать работу со скриптом Pine?
Начать работу со скриптом Pine очень просто, ничего скачивать и устанавливать не нужно.
Если у вас уже есть учетная запись в TradingView, просто перейдите на их страницу.
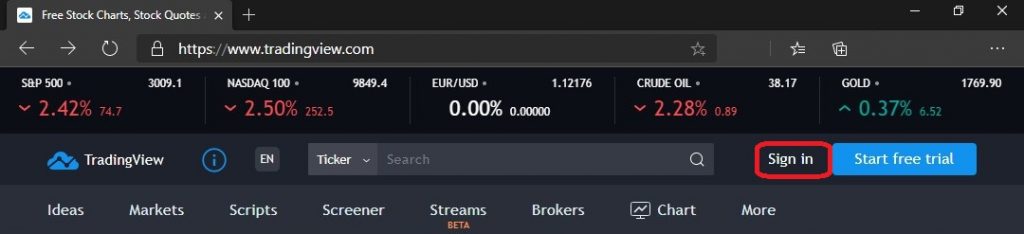
Если у вас нет учетной записи, перейдите на сайт www.tradingview.com. Оттуда вы увидите окно входа в верхний правый угол.
Существует несколько вариантов регистрации в один клик или использование традиционного метода электронной почты/пароля.

Наличие учетной записи позволяет вам сохранять свои скрипты в облаке TradingView и дает возможность добавлять пользовательские индикаторы на графики.
После регистрации запустите графическую платформу, щелкнув график в меню или перейдя на страницу www.tradingview.com/chart.
Первый взгляд на редактор Pine
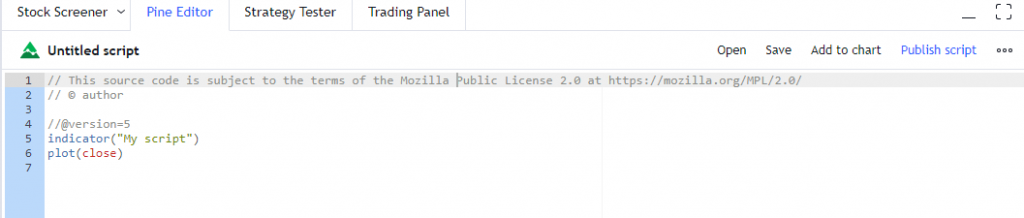
В редакторе Pine мы будем создавать наш код. Чтобы запустить его, нажмите Pine Editor в самом низу экрана.

Должен появиться экран, похожий на изображение ниже.
В скрипте Pine вы будете создавать либо индикатор , либо стратегию . Мы подробно обсудим различия в этой статье.
Если вы следите за ходом, экран, на который вы сейчас смотрите, является начальным сценарием по умолчанию для создания индикатора.
Пробежимся по нему строчка за строчкой.
// This source code is subject to the terms of the Mozilla Public License 2.0 at https://mozilla.org/MPL/2.0/Первая строка — это просто комментарий. Комментарии в скрипте Pine начинаются с двух косых черт.
// © authorВторая строка также является комментарием, она автоматически заполняется вашим именем пользователя TradingView.
//@version=5В четвертой строке вы можете предположить, что у нас есть еще один комментарий. Однако эта линия немного отличается.
Это известно как директива компилятора. Это позволяет компилятору узнать, какую версию скрипта Pine мы хотим использовать.
Вы можете отказаться от первых двух строк комментария, если хотите, но директива компилятора требуется во всех скриптах.
indicator("My Script")Строка 5 является объявлением. Здесь указываете, создаете ли вы индикатор.
Альтернативой является создание стратегии, но мы начнем с индикатора.
Вторая часть строки 5 в кавычках — это имя, которое мы присвоим этому конкретному индикатору. По умолчанию используется Мой сценарий .
plot(close)Строка 6 содержит команду построения графика. Как вы уже, наверное, догадались, она приказывает TradingView построить график определенной переменной.
В этом случае переменная close будет построена. Это встроенная переменная, которая содержит цену закрытия последнего бара.
Давайте нажмем «Добавить в диаграмму» в правом верхнем углу редактора Pine.
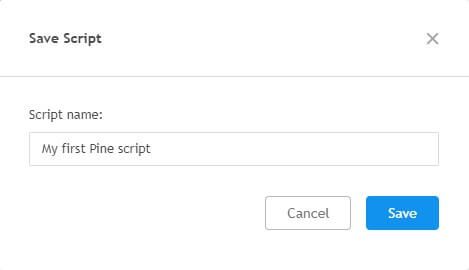
Вам будет предложено сохранить сценарий.
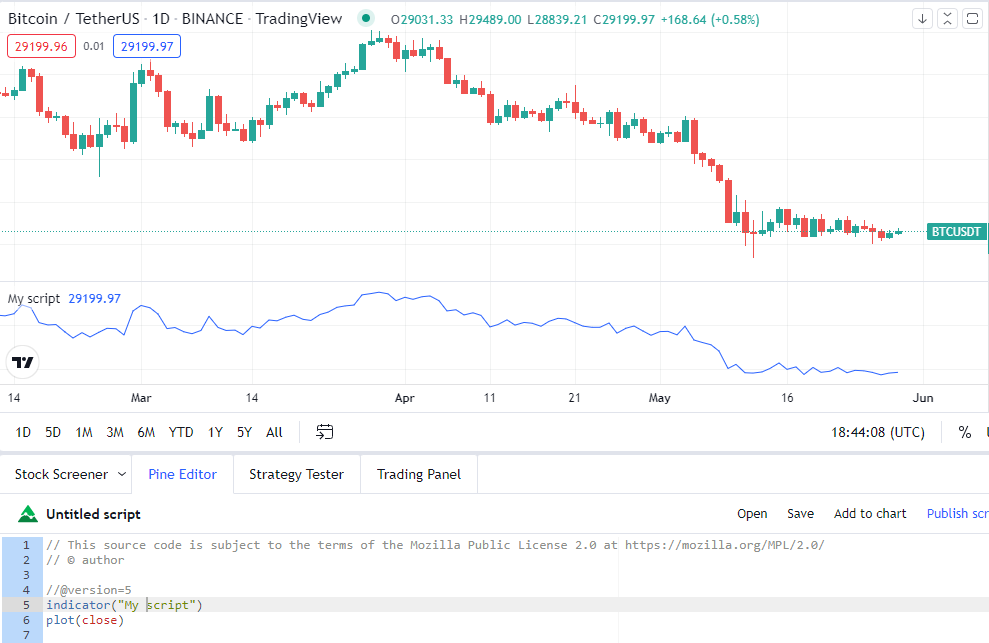
После сохранения ваш график должен получить новое окно, содержащее график цен закрытия с вашего основного графика.
Это окно называется окном данных. На изображении выше это линейная диаграмма, нарисованная синим цветом.
Обратите внимание, что окно данных показывает «Мой сценарий» в верхнем левом углу. Это извлекает все, что введено в строку 5 нашего кода, где мы объявили имя для индикатора.
И вот он, наш первый индикатор, и нам даже не нужно было писать код!
Как узнать цену Apple?
В нашем первом примере мы построили цену закрытия. Скрипт Pine автоматически сделает это для любого открытого графика.
В данном случае у нас был открыт дневной график биткойна.
Но что, если вы хотите получить данные для другого актива? Давайте рассмотрим пример, в котором мы берем цену Apple, даже если у нас нет открытого графика.
Каждый скрипт начинается с нескольких строк, в которых мы устанавливаем директиву компилятора. Мы также указываем, является ли это индикатором или стратегией, которую мы создаем, и присваиваем имя.
//@version=5
indicator("price of Apple")
В данном случае мы создаем индикатор. Название этого индикатора – «цена Apple».
Далее мы должны сообщить Pine Script, что нас интересует актив, отличный от того, что в данный момент отображается на графике.
Для этого мы можем использовать функцию request.security().
request.security()Приятной особенностью скрипта Pine является то, что справка всегда легко доступна, если вы работаете с синтаксисом, с которым раньше не работали.
Например, мы можем навести курсор на нашу функцию, и она покажет краткое описание.
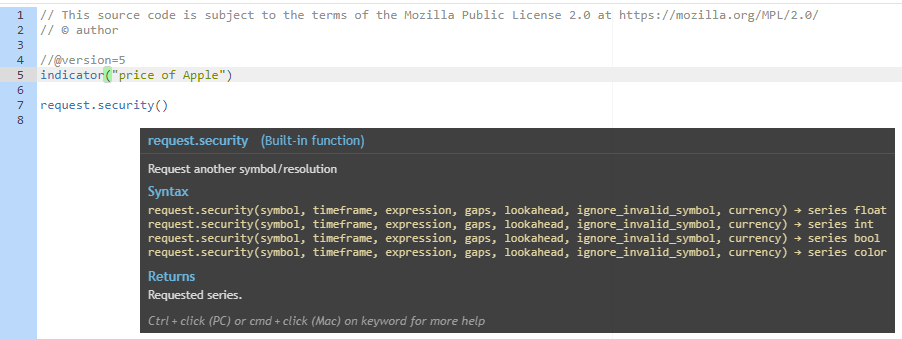
Для получения более подробной информации вы можете запустить окно справки. Для этого нажмите CTRL, щелкнув функцию на ПК. Или, на Mac, нажмите CMD, нажимая на функцию.
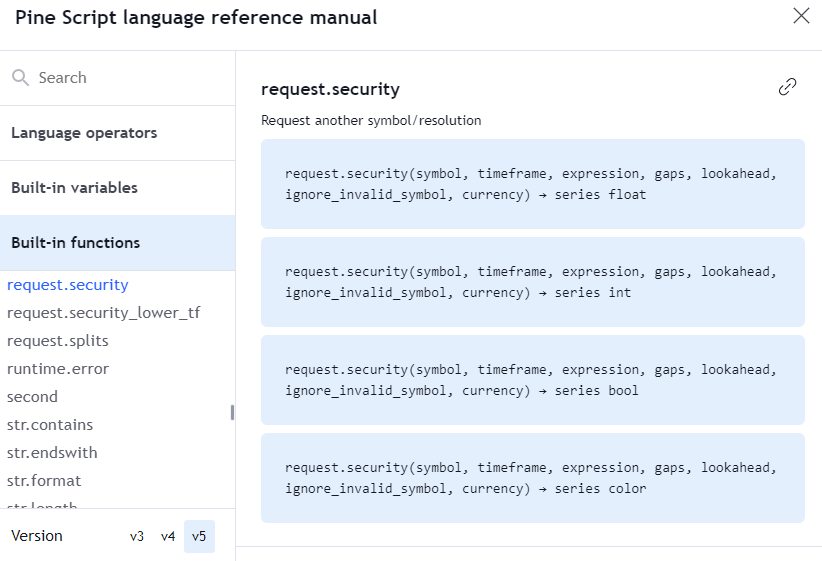
Функция справки разъясняет синтаксис и даже содержит полезные примеры.
request.security("AAPL", "D", close)Мы использовали синтаксис, аналогичный примеру в приведенном выше фрагменте кода. Первым значением в функции безопасности является тикер, который является AAPL.
Затем мы устанавливаем временные рамки на день. И, наконец, мы сообщили скрипту Pine, что нас интересует цена закрытия.
Мы можем сохранить возврат функции в переменную.
apple_price = request.security("AAPL", "D", close)Теперь переменная apple_price будет содержать последнее дневное закрытие акций Apple.
Исследования, созданные в скрипте Pine, должны иметь хотя бы один вывод, иначе скрипт выдаст ошибку компилятора.
Давайте построим нашу переменную так, чтобы она удовлетворяла правилу сценария Pine о наличии вывода.
plot(apple_price)После сохранения и добавления на график наш экран выглядит так.
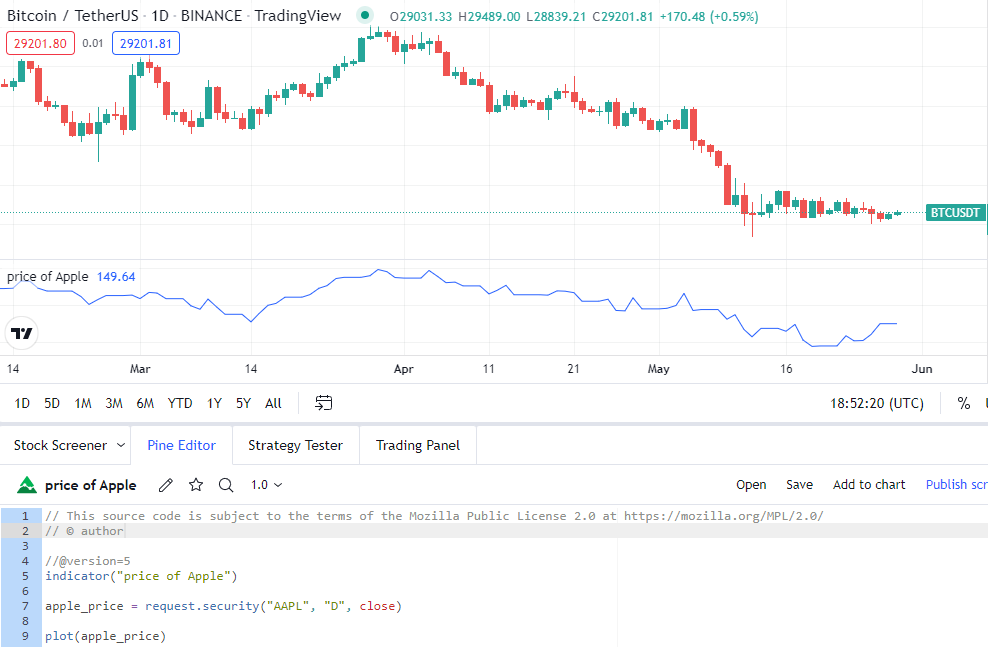
Теперь у нас есть дневная цена закрытия Apple, отображаемая в окне данных, в то время как в главном окне отображается свечной график биткойнов.
Полный код:
//@version=5
indicator("price of Apple")

apple_price = request.security("AAPL", "D", close)

plot(apple_price)
Как получить SMA ( 20 ) Apple?
Теперь, когда мы можем получить доступ к цене акций Apple, давайте рассмотрим пример получения простой скользящей средней.
Тот же процесс можно использовать для применения любого индикатора.
Мы начнем с наших основных объявлений и используем функцию безопасности, которую мы создали в нашем последнем примере.
//@version=5
indicator("Get 20 SMA of Apple")

// Get price of Apple
apple_price = request.security("AAPL", "D", close) // 1 Day
Если вы не хотите получать 20 SMA специально для AAPL, вы можете пропустить определение безопасности и просто использовать встроенную переменную close.
Это позволит получить цену закрытия для любой ценной бумаги, которая отображается в главном окне графика.
В скрипт Pine встроена вспомогательная функция для индикатора SMA. Чтобы получить к нему доступ, мы просто используем функцию ta.sma().
ta.sma(apple_price, 20)Первый параметр, который нам нужно передать, — это значение цены. В этом случае мы используем цену закрытия для Apple, которую мы сохранили в нашей переменной apple_price.
Второй параметр — длина SMA. Мы ищем 20-периодную SMA.
Наконец, мы назначим данные SMA отдельной переменной, а затем построим ее.
apple_sma = ta.sma(apple_price, 20)

plot(apple_sma)
Простая скользящая средняя для Apple теперь отображается в нашем окне данных.
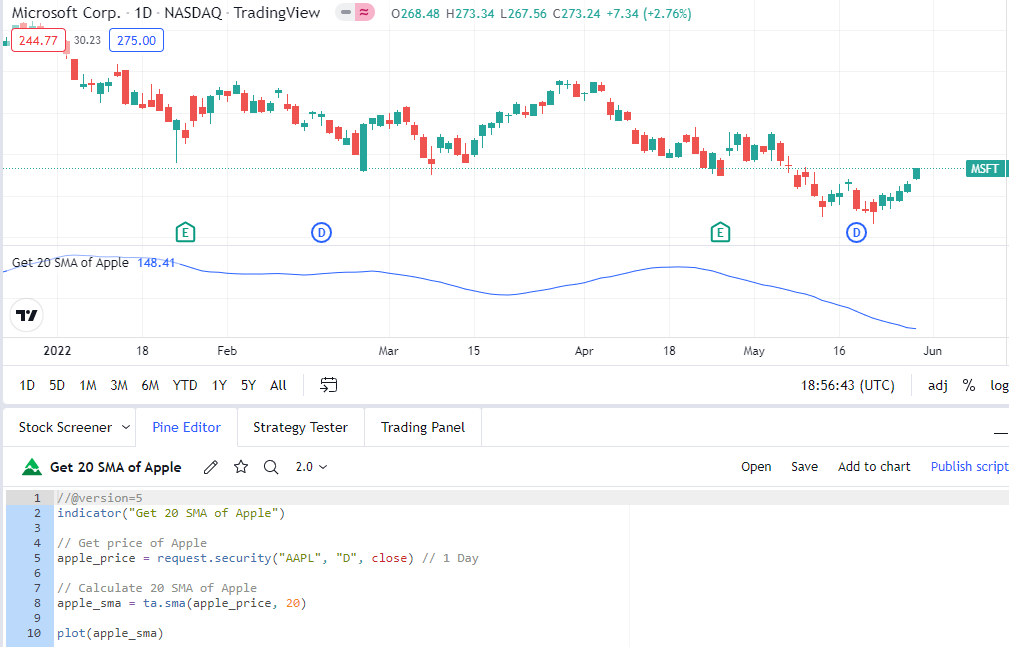
Скользящие средние обычно наносятся на основной график. Мы можем добиться этого с помощью небольшой модификации нашего кода.
indicator("Get 20 SMA of Apple", overlay=true)Добавив в overlay=Trueобъявление индикатора, мы можем отображать наши данные непосредственно в главном окне графика, а не в окне данных.
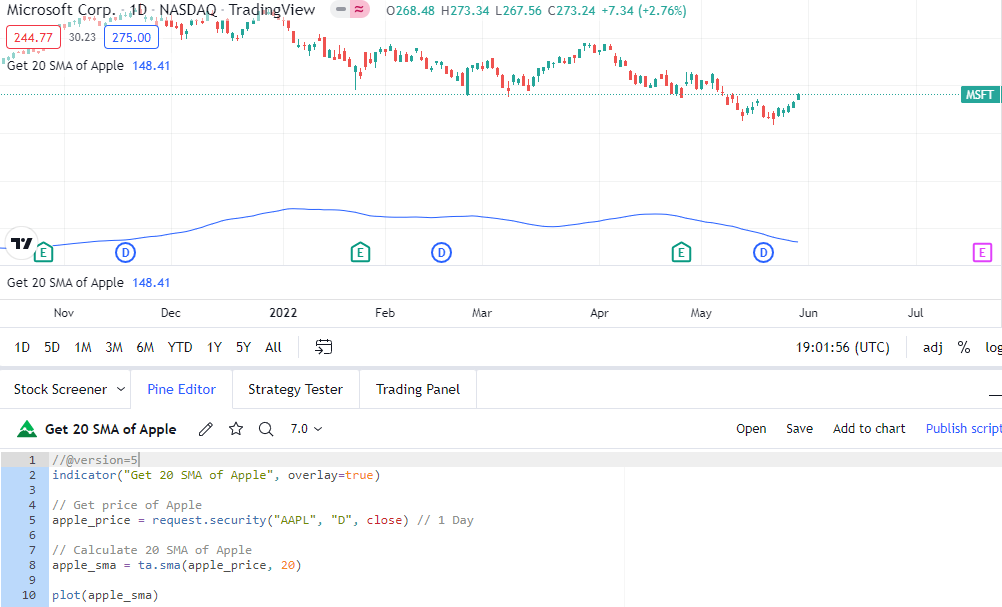
Полный код:
//@version=5
indicator("Get 20 SMA of Apple", overlay=true)

// Get price of Apple
apple_price = request.security("AAPL", "D", close) // 1 Day

// Calculate 20 SMA of Apple
apple_sma = ta.sma(apple_price, 20)

plot(apple_sma)
Как протестировать кросс-стратегию скользящих средних с помощью Pine Script?
Мы прошлись по индикаторам. Давайте посмотрим на стратегии в Pine Script.
В следующем примере мы создадим стратегию пересечения скользящих средних с несколькими дополнительными параметрами. Затем мы проверим стратегию на истории в TradingView.
//@version=5
strategy("My Strategy", overlay=true)
Чтобы создать стратегию, мы заменяем объявление индикатора объявлением стратегии.
// Create Indicator's
shortSMA = ta.sma(close, 10)
longSMA = ta.sma(close, 30)
Первое, что нам нужно сделать, это создать две скользящие средние и присвоить данные переменным.
rsi = ta.rsi(close, 14)Мы также создадим индикатор RSI, который будет использоваться для подтверждения наших входов и выходов.
Эта стратегия будет работать на основном графике, поэтому нам не нужно использовать здесь функцию security().
Далее мы хотим указать наши условия кроссовера. К счастью, в TradingView уже есть встроенная функция для этого, поэтому нам не нужно кодировать ее вручную.
// Specify crossover conditions
longCondition = ta.crossover(shortSMA, longSMA)
shortCondition = ta.crossunder(shortSMA, longSMA)
У нас есть два условия, первое — когда короткая SMA с периодом 10 пересекает более длинную SMA с периодом 30.
Второе условие является противоположным, поскольку мы использовали функцию crossunder, а не crossover.
Оба эти условия сохраняются в переменных. Поэтому, когда происходит пересечение (crossover или crossunder), эти переменные будут обновлены до True, что является логическим значением.
Мы можем использовать оператор if, чтобы проверить, изменилось ли условие на True, а затем выполнить сделку, если это так.
if (longCondition)
    strategy.entry("long", strategy.long, 100, when = rsi > 50)
Встроенная strategy.entryфункция используется для входа в сделки. Вот параметры, которые передаются в функцию.
- long — это идентификатор сделки. Мы не будем использовать его в этом примере. Но, если вы планируете закрыть или отменить сделку, это можно сделать с помощью этого идентификатора.
- Strategy.long — это встроенная переменная, которая сообщает скрипту Pine, что мы хотим открыть длинную позицию.
- 100 — количество акций, которыми мы хотим торговать
- when = rsi > 50 — это дополнительный параметр, который указывает скрипту pine выполнять сделку только в том случае, если RSI выше 50.
Синтаксис наших кратких записей будет очень похож на формат.
if (shortCondition)
    strategy.entry("short", strategy.short, 100, when = rsi < 50)
Поскольку мы используем стратегию, нам не нужно ничего строить или задавать выходные данные.
Но мы все равно это сделаем. Было бы неплохо увидеть SMA на графике, чтобы мы могли подтвердить, что сделки имели место, когда они должны были быть.
// Plot Moving Average's to chart
plot(shortSMA)
plot(longSMA, color=color.black)
Если мы сохраним и добавим на график, стратегия запустится и автоматически откроет окно тестера стратегий , в котором будут отображаться некоторые важные статистические данные.
Вот так выглядит наш экран.
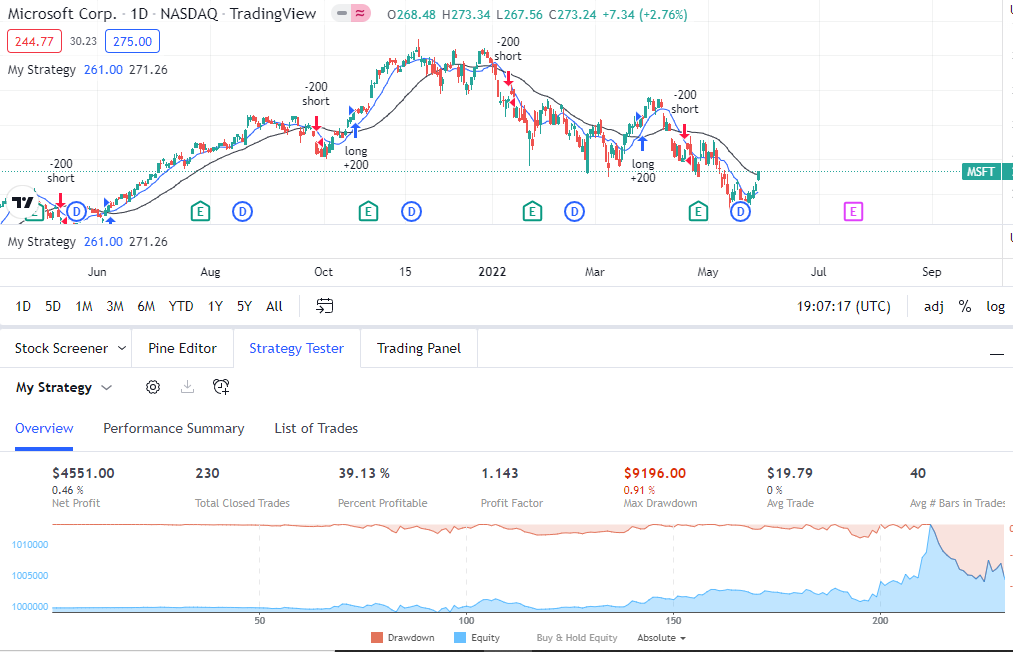
По умолчанию открывается новая вкладка с обзорной статистикой по стратегии. Вы можете щелкнуть сводку по эффективности или список сделок, чтобы увидеть другую статистику.
Стратегия будет работать на таймфрейме, который отображается на вашем графике.
Вы можете легко переключаться между различными временными рамками, используя параметры временных рамок в меню в верхней части экрана. Стратегия будет автоматически обновляться в соответствии с выбранным новым таймфреймом.
Полный код:
//@version=5
strategy("My Strategy", overlay=true)

// Create Indicator's
shortSMA = ta.sma(close, 10)
longSMA = ta.sma(close, 30)
rsi = ta.rsi(close, 14)

// Specify crossover conditions
longCondition = ta.crossover(shortSMA, longSMA)
shortCondition = ta.crossunder(shortSMA, longSMA)

// Execute trade if condition is True
if (longCondition)
    strategy.entry("long", strategy.long, 100, when = rsi > 50)

if (shortCondition)
    strategy.entry("short", strategy.short, 100, when = rsi < 50)

// Plot Moving Average's to chart
plot(shortSMA)
plot(longSMA, color=color.black)
Как установить тейк-профит и стоп-лосс?
В нашем последнем примере исполнение сделки определялось пересечением и пересечением скользящих средних.
Мы будем опираться на этот скрипт и установим конкретные стоп-лоссы и тейк-профиты. Мы можем использовать средний истинный диапазон (ATR) для расчета уровней для них.
Индикатор ATR рассчитывает среднее движение за последнее количество указанных баров. Это хороший способ учета изменений волатильности.
Мы уже объявили несколько индикаторов, добавим в список индикатор ATR.
// Create Indicator's
shortSMA = ta.sma(close, 10)
longSMA = ta.sma(close, 30)
rsi = ta.rsi(close, 14)
atr = ta.atr( 14 )
В наших торговых условиях мы можем сделать необходимые расчеты для нашего стоп-лосса и тейк-профита.
if (longCondition)
    stopLoss = low - atr * 2
    takeProfit = high + atr * 2
    strategy.entry("long", strategy.long, 100, when = rsi > 50)
    strategy.exit("exit", "long", stop=stopLoss, limit=takeProfit)
В приведенном выше коде мы рассчитали стоп-лосс, взяв минимум бара во время входа и вычтя средний истинный диапазон, умноженный на два.
Таким образом, если акции двигаются в среднем на 5 долларов за бар, мы устанавливаем тейк-профит на 10 долларов ниже минимума.
Аналогичный расчет делается для тейк-профита.
Наконец, мы указываем условие выхода, используя функцию Strategy.exit(). Вот параметры, которые были переданы.
- exit — это идентификатор сделки для выхода из сделки.
- long — это идентификатор, который мы ранее установили при входе в сделку. Это позволит скрипту Pine узнать, из какой позиции мы пытаемся выйти.
- stop=stopLoss – указываем, что уровень, содержащийся в переменной stopLoss, должен использоваться как стоп-ордер на выход из сделки.
- limit=takeProfit = мы указываем, что уровень, содержащийся в переменной takeProfit, должен использоваться как лимитный ордер для выхода из сделки.
Синтаксис нашего короткого условия аналогичен, хотя некоторые вычисления немного отличаются.
if (shortCondition)
    stopLoss = high + atr * 2
    takeProfit = low - atr * 2
    strategy.entry("short", strategy.short, 100, when = rsi < 50)
    strategy.exit("exit", "short", stop=stopLoss, limit=takeProfit)
Остальная часть скрипта остается неизменной по сравнению с предыдущим примером. Давайте запустим его и посмотрим, как сработала наша стратегия.
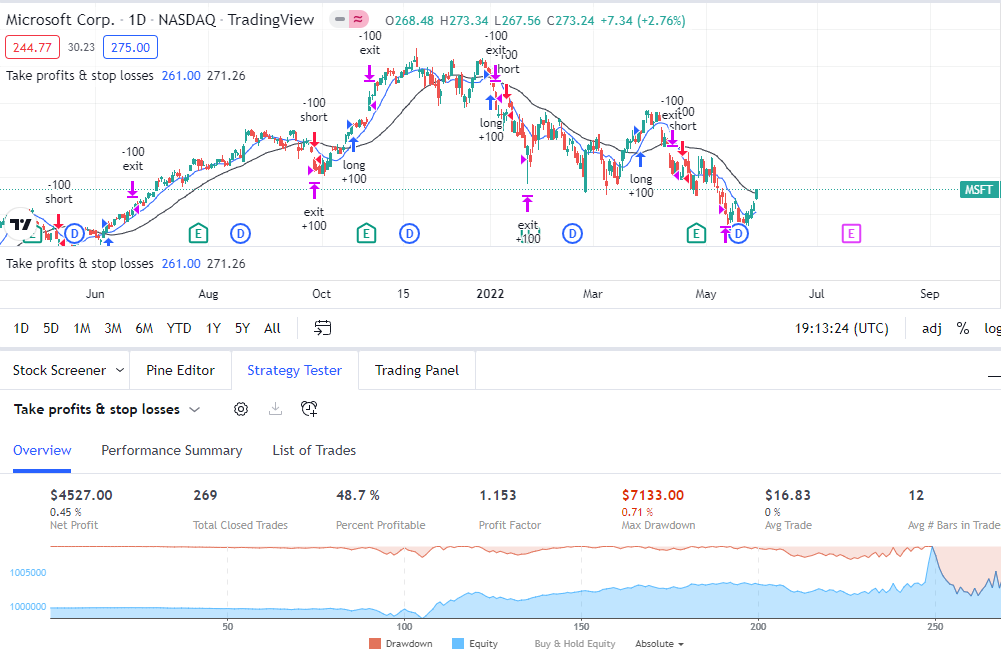
Наши выходы работают и отображаются на нашем основном графике вместе с длинными и короткими входами.
Полный код:
//@version=5
strategy("Take profits & stop losses", overlay=true)

// Create Indicator's
shortSMA = ta.sma(close, 10)
longSMA = ta.sma(close, 30)
rsi = ta.rsi(close, 14)
atr = ta.atr( 14 )

// Specify crossover conditions
longCondition = ta.crossover(shortSMA, longSMA)
shortCondition = ta.crossunder(shortSMA, longSMA)

// Execute trade if condition is True
if (longCondition)
    stopLoss = low - atr * 2
    takeProfit = high + atr * 2
    strategy.entry("long", strategy.long, 100, when = rsi > 50)
    strategy.exit("exit", "long", stop=stopLoss, limit=takeProfit)

if (shortCondition)
    stopLoss = high + atr * 2
    takeProfit = low - atr * 2
    strategy.entry("short", strategy.short, 100, when = rsi < 50)
    strategy.exit("exit", "short", stop=stopLoss, limit=takeProfit)

// Plot Moving Average's to chart
plot(shortSMA)
plot(longSMA, color=color.black)
Как запустить сделку с Apple, когда Google движется на 5%?
Мы видели, что функцию безопасности можно использовать для отображения данных по акциям, не отображаемым на экране.
Мы будем использовать его для создания стратегии, которая будет выполнять сделку в Apple, если Google движется более чем на 5%.
Это стратегия возврата к среднему, поэтому, если Google вырастет более чем на 5%, мы продадим Apple. Если Google упадет более чем на 5%, мы сможем купить Apple.
Первое, что мы сделаем, это сохраним ежедневную цену открытия и закрытия Google в переменной.
//@version=5
strategy("Pair Trade: Apple & Google")

google_close = request.security("GOOG", "D", close)
google_open = request.security("GOOG", "D", open)
Затем мы можем выполнить расчет, чтобы определить процентное изменение цены.
price_change = google_close / google_openТеперь переменная price_change содержит вычисление. Так, например, если Google открылся на уровне 100 долларов и вырос на 5%, чтобы закрыться на уровне 105 долларов, переменная price_change будет равна 105/100, что равно 1,05.
Но если Google открылся на уровне 100 долларов и снизился на 5%, чтобы закрыться на уровне 95 долларов, переменная будет выглядеть как 95/100, что равно 0,95.
Итак, мы знаем, что если Google откажется на 5% или больше, переменная price_change будет равна 0,95 или меньше, и мы хотим открыть длинную позицию. Вот синтаксис для этого.
if price_change < 0.95
    strategy.entry("long", strategy.long, 100)
И синтаксис, чтобы получить короткий, если Google сплачивает более 5%.
if price_change > 1.05
    strategy.entry("short", strategy.short, 100)
Вы могли заметить, что мы не упомянули в коде цену акций Apple. Все, что нам нужно сделать, это открыть график AAPL, и он автоматически узнает, что нужно совершать сделки в Apple.
Наконец, мы построим переменную price_change в окне данных. Это не обязательно, но приятно видеть, и мы можем подтвердить, что сделки выполняются должным образом.
plot(price_change)И вот результаты нашей стратегии.

Только четыре сделки, так как 5% движения встречаются редко. Нам, вероятно, потребуется увидеть намного больше сделок, чтобы определить, является ли это хорошей стратегией.
Похоже, была проделана хорошая работа, чтобы выбрать этот минимум в марте!
Полный код:
//@version=5
strategy("Pair Trade: Apple & Google")

google_close = request.security("GOOG", "D", close)
google_open = request.security("GOOG", "D", open)

price_change = google_close / google_open

if price_change < 0.95
    strategy.entry("long", strategy.long, 100)

if price_change > 1.05
    strategy.entry("short", strategy.short, 100)

plot(price_change)
Как модифицировать наши скрипты без кодирования?
Отличительной особенностью скрипта Pine является то, что мы можем создавать собственные входные данные, чтобы легко изменять параметры наших стратегий и индикаторов.
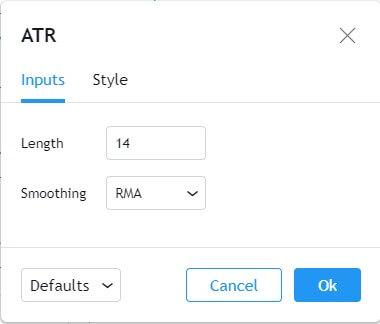
Взгляните на стандартный индикатор ATR, предлагаемый в Tradingivew. Обратите внимание, как легко изменить длину и даже цвета на вкладке «Стиль».
Мы можем добиться того же для исследований и стратегий, созданных в скрипте Pine, с помощью функции input().
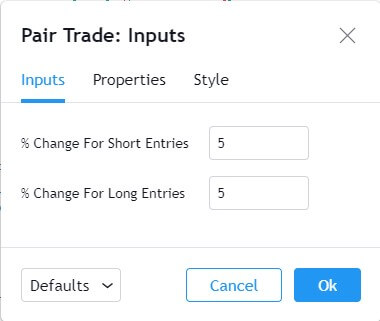
Вот пример функции ввода, которая позволит пользователю настроить процентное изменение по сравнению с последним примером стратегии.
longTrigger = input(title="% Change for short entries", defval=5)

shortTrigger = input(title="% Change for long entries", defval=5)
Давайте пройдемся по параметрам, которые передаются через функцию input().
- title — здесь мы указываем текст, который видит пользователь при попытке изменить значение этого конкретного параметра.
- defval — это значение по умолчанию.
Теперь мы можем получить значения от пользователя. Но они будут вводить значение, такое как 5 (%). Нам нужно преобразовать это в 1,05 для наших операторов if.
longTrigger := 1 - longTrigger/100
shortTrigger := 1 + shortTrigger/100
И нам нужно изменить наши операторы if, чтобы они смотрели на наши вновь созданные переменные на основе пользовательского ввода, а не на ранее жестко закодированных значениях.
if price_change < longTrigger
    strategy.entry("long", strategy.long, 100)

if price_change > shortTrigger
    strategy.entry("short", strategy.short, 100)
Чтобы получить доступ к параметрам ввода, щелкните значок шестеренки рядом с названием вашей стратегии в окне данных.
![]()
Пользовательские значения теперь могут быть установлены для процентного изменения, используемого в стратегии.
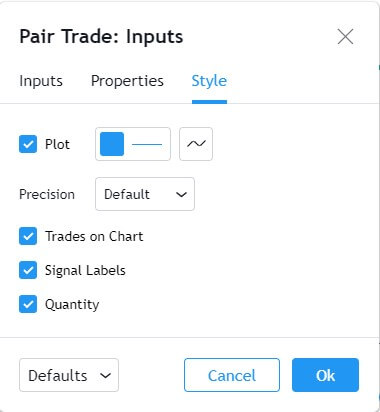
Существует также окно свойств, которое позволит вам установить пользовательские параметры для других частей стратегии.

И окно стиля для настройки параметров печати.
Полный код:
//@version=5
strategy("Pair Trade: Inputs")

longTrigger = input(title="% Change for short entries", defval=5)
shortTrigger = input(title="% Change for long entries", defval=5)

longTrigger := 1 - longTrigger/100
shortTrigger := 1 + shortTrigger/100

google_close = request.security("GOOG", "D", close)
google_open = request.security("GOOG", "D", open)

price_change = google_close / google_open

if price_change < longTrigger
    strategy.entry("long", strategy.long, 100)

if price_change > shortTrigger
    strategy.entry("short", strategy.short, 100)

plot(price_change)
Как построить сценарий с помощью Pine?
До сих пор мы использовали стандартную функцию plot() для вывода определенных элементов на экран. Сценарий Pine имеет несколько других команд, которые мы можем использовать для нашего вывода, и мы рассмотрим некоторые из них.
График работы рынка Форекс
Нужно помнить, когда рынки открываются и закрываются. Это может быть довольно сложно понять трейдерам Forex.
Форекс торгует 24 часа в сутки и 5 дней в неделю. Различные рынки по всему миру открываются и закрываются в течение дня, что влияет на волатильность валюты.
Давайте запрограммируем индикатор, который, взглянув на график, покажет нам, когда ожидается наибольшая занятость на рынках.
Большинство трейдеров Форекс обращают внимание на лондонскую и нью-йоркскую сессии. Мы начнем с указания времени для этих сессий.
//@version=5
indicator("Forex Sessions", overlay=true)

London = time(timeframe.period, "0700-1500")
NY = time(timeframe.period, "1200-2000")
Здесь мы использовали функцию time() для создания периода. В параметрах мы используем 07:00 UTC для времени начала лондонской сессии и 15:00 UTC для времени окончания.
Переменная London теперь будет содержать время бара, если бар попадает между этим периодом. В противном случае он покажет NaN («не»-значение).
Мы можем использовать оператор if, чтобы проверить вывод переменной London.
val = if (na(London))
    1
else
    0
В приведенном выше коде мы используем встроенную функцию na(). Это проверяет, имеет ли переменная значение NaN или нет.
если переменная London возвращает значение NaN, это означает, что бар находится вне лондонских торговых часов.
В этом случае вызываемой переменной val будет присвоено целое число 1. В противном случае переменной будет присвоено значение val0.
Наконец, мы отрисуем только что созданную переменную val.
plot(val)Вот как выглядит наш график после сохранения и добавления этого индикатора на график.
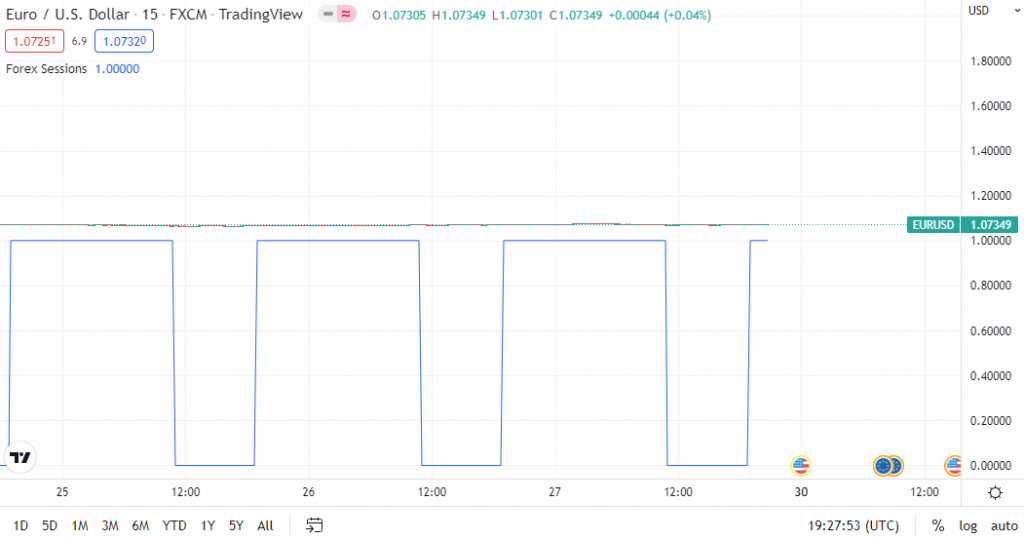
Это выглядит не слишком хорошо. Он правильно показывает, когда лондонский рынок открыт, но построение этих значений сделало наши свечи неразборчивыми.
Мы могли бы построить его в окне данных, чтобы свечи было лучше видно, но визуализировать открытие и закрытие рынка все равно было бы непросто.
Кроме того, код выглядит не слишком хорошо.
Давайте начнем с использования однострочного оператора if, чтобы немного очистить наш код.
na(London) ? 1 : 0Этот код выполняет ту же функцию, что и предыдущий оператор if. В этом случае нам не нужно использовать переменную val. Разберем синтаксис.
na(London)Эта часть проверяет, содержит ли переменная London значение NaN.
? 1 : 0Знак вопроса здесь — это краткая форма оператора if/else.
То, что следует за вопросительным знаком, является важной частью. Здесь два числа, разделенные двоеточием. Число перед двоеточием, в данном случае 1, — это то, что должно быть возвращено в случае, если оператор if верен.
Число после двоеточия, в данном случае 0, возвращается, когда оператор if возвращает false.
Затем мы можем взять весь синтаксис и обернуть его в функцию построения графика, сэкономив усилия на его предварительном сохранении в переменной.
plot(na(London) ? 1 : 0)Итак, теперь мы превратили оператор if в однострочный фрагмент кода.
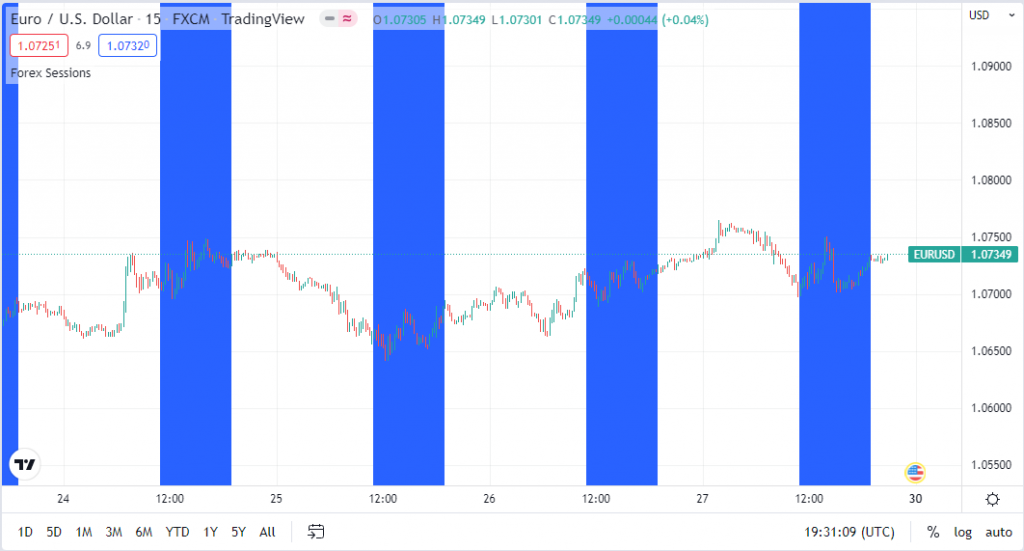
Чтобы сделать график более удобным для чтения, мы можем нанести другой цвет фона, если лондонский рынок открыт.
Для этого мы заменяем функцию plot() на функцию bgcolor(). Это позволяет нам изменить цвет фона.
bgcolor(na(London) ? 1 : 0)Также мы укажем цвет, когда рынок открыт.
bgcolor(na(London) ? na : color.blue)Наша диаграмма начинает выглядеть намного лучше!
Последнее, что мы сделаем, это добавим код, чтобы увидеть, открыт ли рынок в Нью-Йорке, и установим зеленый фон, если это так.
bgcolor(na( NY ) ? na : color.green)Вы заметите, что на приведенной ниже диаграмме есть три цвета.
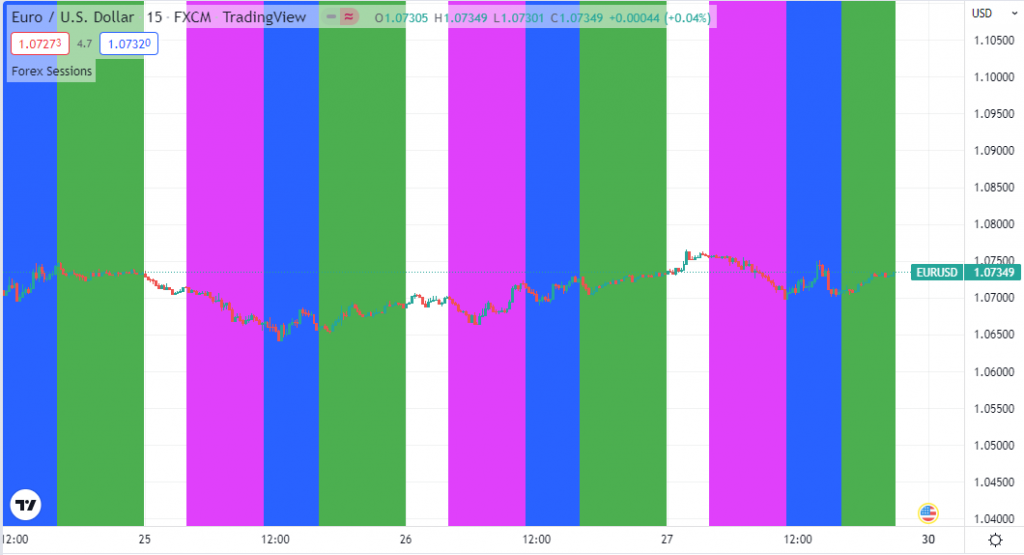
Это связано с тем, что лондонская и нью-йоркская сессии пересекаются, и обычно это самое волатильное время дня.
Теперь мы можем легко увидеть сессии и быстро выделить такие вещи, как максимум, установленный на европейских торгах, или минимум, который был напечатан во время перекрытия.
Полный код:
//@version=5
indicator("Forex Sessions", overlay=true)

Tokyo = time(timeframe.period, "0000-0800")
London = time(timeframe.period, "0700-1500")
NY = time(timeframe.period, "1200-2000")

bgcolor(na(Tokyo) ? na : color.fuchsia)
bgcolor(na(London) ? na : color.blue)
bgcolor(na( NY ) ? na : color.green)
Нанесение аннотаций
Существует несколько вариантов печати аннотаций. Например, вы можете использовать функцию hline() для рисования горизонтального уровня на графике.
Существует функция plotchar(), которая позволяет отображать символы ASCII на графике. Это часто используется для построения заметки сверху или снизу ценового бара.
Другой распространенной функцией построения графиков является plotshape(), которая позволяет отображать различные фигуры. Этот довольно популярен, так как многие люди используют его для построения стрелок вверху или внизу столбцов, чтобы показать сигналы покупки или продажи.
Полный список различных доступных аннотаций см. в разделе Обзор аннотаций в руководстве пользователя скрипта Pine.
Как я могу создать собственный индикатор в скрипте Pine?
Мы собираемся создать мультитаймфреймовый индикатор.
Это основано на стратегии скальпинга, которую я использовал, когда впервые начал торговать. Это стратегия возврата к среднему, которая хорошо работает в начале азиатской сессии на рынках Forex, когда в целом все спокойно.
Стратегия использует полосы Боллинджера на 5-минутном графике и RSI на 1-минутном графике.
Идея состоит в том, чтобы искать расхождение rsi на 1-минутном графике, когда цена достигает верхней или нижней полосы Боллинджера на 5-минутном графике.
Потенциальной целью является средняя линия 5-минутной полосы Боллинджера или нижняя линия 1-минутной полосы Боллинджера.
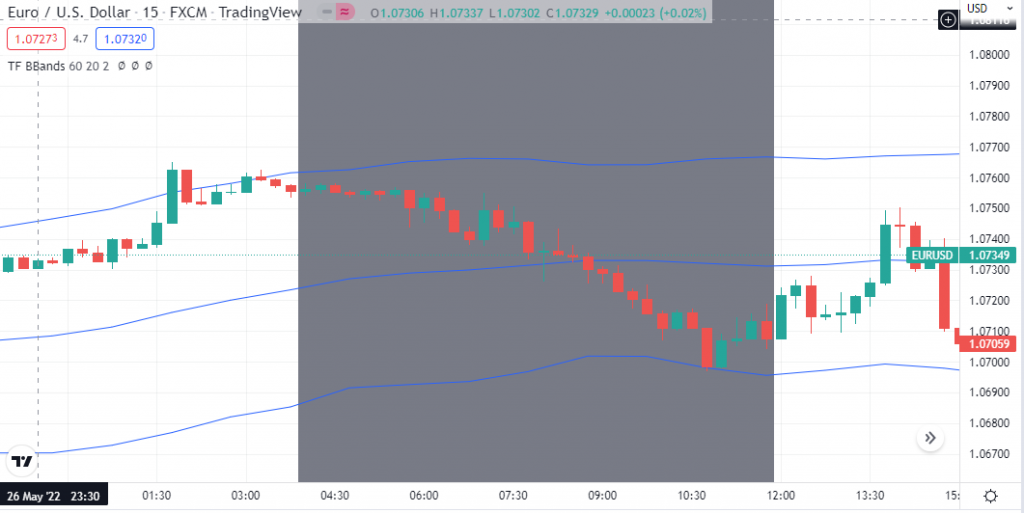
Изображение выше является примером стратегии. Индикатор сессий Forex, который мы использовали в предыдущем примере, был использован здесь, чтобы показать, когда открыта азиатская сессия.
Эта стратегия лучше всего работает в первой половине сессии, после чего риск прорыва или направленного движения имеет тенденцию к увеличению.
Когда я торговал по этой стратегии, мне приходилось держать открытыми два графика: 1-минутный и 5-минутный.
Но в приведенном выше примере показаны 5-минутные полосы Боллинджера, нарисованные непосредственно на 1-минутном графике. Мы создадим этот индикатор в скрипте Pine.
//@version=5
indicator(title="Higher TF BBands", shorttitle="TF BBands", overlay=true)
Начнем с объявления имени скрипта и указания, что это индикатор. Также можно добавить более короткое название, это имя будет отображаться на диаграммах.
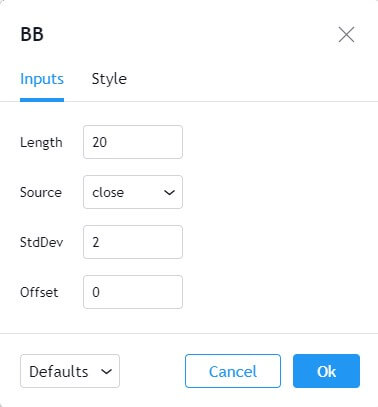
Затем мы устанавливаем некоторые пользовательские входы. Мы можем дублировать большинство входных данных из обычного индикатора полосы Боллинджера (как показано на изображении выше) для нашего пользовательского индикатора.
// Get user input
tf = input(title="BBands Timeframe", defval="5")
len = input(title="Length", defval=20)
stddev = input(title='StdDev', defval=2)
Мы можем создать индикатор полосы Боллинджера из встроенной вспомогательной функции.
[middle, upper, lower] = ta.bb(close, len, stddev)Эта функция возвращает три значения. Нижняя, средняя и верхняя полоса. Они сохраняются индивидуально в переменные.
Значения должны рассчитываться на другом таймфрейме. Мы можем использовать функцию security(), чтобы указать временной интервал, выбранный пользователем.
Это сохраняется в переменной tf, созданной предыдущим пользовательским вводом.
hbbandsMid = request.security(syminfo.tickerid, tf, middle, barmerge.gaps_on, barmerge.lookahead_off)
hbbandsUpper = request.security(syminfo.tickerid, tf, upper, barmerge.gaps_on, barmerge.lookahead_off)
hbbandsLower = request.security(syminfo.tickerid, tf, lower, barmerge.gaps_on, barmerge.lookahead_off)
Символ тикера остается прежним, поэтому мы использовали значение syminfo.tickerid, которое будет возвращать любой тикер, отображаемый на основном графике.
Вот и все, осталось построить новый индикатор.
plot(hbbandsMid)
plot(hbbandsUpper)
plot(hbbandsLower)
Теперь мы можем видеть полосы Боллинджера на 5-минутном графике, отображаемом на 1-минутном графике.
Входные данные позволяют легко настраивать параметры полос Боллинджера и позволяют этому индикатору работать с любой комбинацией таймфреймов.
Полный код:
//@version=5
indicator(title="Higher TF BBands", shorttitle="TF BBands", overlay=true)

// Get user input
tf = input(title="BBands Timeframe", defval="60")
len = input(title="Length", defval=20)
stddev = input(title='StdDev', defval=2)

[middle, upper, lower] = ta.bb(close, len, stddev)

hbbandsMid = request.security(syminfo.tickerid, tf, middle, barmerge.gaps_on, barmerge.lookahead_off)
hbbandsUpper = request.security(syminfo.tickerid, tf, upper, barmerge.gaps_on, barmerge.lookahead_off)
hbbandsLower = request.security(syminfo.tickerid, tf, lower, barmerge.gaps_on, barmerge.lookahead_off)

plot(hbbandsMid)
plot(hbbandsUpper)
plot(hbbandsLower)
Последние мысли
Если вы следили за примерами, у вас будет хорошее представление о том, на что способен скрипт Pine.
В целом, со скриптом Pine можно многое сделать, хотя у него есть определенные ограничения. Можно очень быстро написать стратегию, как только вы во всем разберетесь.
Оттуда всегда можно взять эту логику и запрограммировать ее на другом языке, если вы хотите использовать ее и сторонние библиотеки.
Функции построения графиков великолепны, а возможность создавать пользовательские индикаторы действительно полезна как для ручных трейдеров, так и для автоматизированных систем.
Полная статистика, предлагаемая для стратегий, также является большим плюсом скрипта Pine.
У TradingView есть несколько ресурсов, если вы хотите продвинуть свои навыки кодирования скриптов Pine на шаг дальше.

Некоторые справочные функции уже обсуждались в этой статье. Кроме того, в редакторе Pine есть опция справки.
Вот еще несколько ресурсов —
- Руководство по быстрому запуску — здесь приводится пример индикатора и разбивается сценарий построчно.
- Руководство пользователя Pine Script v5 — Подробное руководство по скрипту Pine.
- Блог TradingView – объявления о новых функциях, которые часто содержат примеры кода.
- Библиотека скриптов TradingView — библиотека исследований и стратегий Pine с открытым исходным кодом.
Последний вариант в списке — отличный ресурс, так как обычно другими трейдерами уже разработан нужный вам индикатор или стратегию.
Это также хороший источник идей для создания собственных индикаторов или стратегий.
Если вы хотите попробовать некоторые из примеров, загрузите весь код одним щелчком мыши на GitHub. Просто нажмите зеленую кнопку и выберите «Загрузить zip». Код будет в текстовых файлах, которые можно скопировать в редактор Pine Tradingview.
Читать оригинал руководства от Algotrading101
Рекомендуем к прочтению:
Лучшие индикаторы TradingView 2022
Лучшие альтернативы TradingView
Сегодня в тренде 
 Новости криптовалют
→
 Real check — 21 февраля 2021

1 комментарий
Популярная тема среди продвинутых людей: «Как самому написать индикатор или стратегию на tradingview«.
Все очень просто и делается интуитивно, в Трейдингвью применяется pine script.
Открываем внизу графиков вкладку pine script
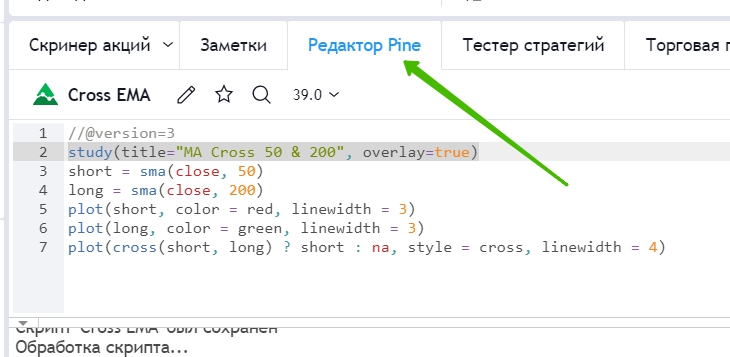
Далее начинаем писать код
Пишем свой индикатор
Сперва нужно научиться писать индикаторы, а потом уже стратегии.
Итак:
1. Сверху пишем версию pine script — можно и без этого пункта
//@version=3
или
//@version=4
2. слово Study — означает, что пишем как раз индикатор.
study(title= «MA Cross 14 & 28», overlay=true)
title — это название нашего индикатора, которое будет отображаться на графике
overlay=true означает отобразить поверх графика
3. Указываем входные данные. У нас это sma 14 и 28. Запишем их в переменные, short — короткий период, long — длинный период
short = sma(close, 14)
long = sma(close, 28)
4. Начинаем рисовать, это делается при помощи функции plot
plot(short, color = red, linewidth = 3)
plot(long, color = green, linewidth = 3)
Тут видно, что мы задействуем переменные, которые указали выше, а также цвет линий и ширину
Все! уже можно нажимать Сохранить (там же ) и Добавить на график!
Теперь вы видите их на графике это скользящие средние.
5. Можно жирным выделить пересечение данных MA для наглядности
plot(cross(short, long) ? short : na, style = cross, linewidth = 4)
Все поздравляю — индикатор готов и им можно пользоваться, подогнав цифры под себя.
Пишем свою стратегию
Тут в центре — условия, то же самое, что в индикаторах (писали выше), только сверху и снизу меняется.
Сверху вместо study пишем :
strategy(«Cross EMA», overlay=true)
Внизу: уже будут команды
Смотрите также: как влияет маржинальная торговля на здоровье
Порекомендовать друзьям:
Pine Script — скриптовый язык программирования для создания индикаторов и стратегий для платформы TradingView. Разработчики утверждают что большинство встроенных индикаторов написаны также на Pine.
Я также записал несколько видео посвященных как платформе TradingView, так и языку программирования Pine Script. Если формат видео удобнее то все они в плейлисте TradingView + Pine Script.
Скрипты пишутся во встроенном в платформу редакторе, исходные коды также сохраняются на платформе и могут быть как публичными, так и приватными.
Если скрипт публичен, то его исходный код может увидеть любой пользователь TradingView. В одно нажатие этот код может быть скопирован, а затем изменен и оставлен в привате или опубликован после изменения.
Скрипт по сути простыня текста, которая содержит выражения, операторы, определения функций и вызовы функций. Язык простой. Здесь нет ни классов, ни разбиения на файлы/классы и прочее. Полноценная декомпозиция невозможна. Поддержки версий нет. Использовать какие либо IDE нельзя. Доступа из скрипта в консоль в Pine Editor нет, как и инструментов отладки (но сообщения компилятора и ошибки в консоль выводятся).
Результат работы скрипта это либо вывод информации на график (индикатор) или совершение сделок (стратегия).
Важно про обновление Pine Script до версии 5
В конце 2021 года Pine Script обновился до версии 5 и в этом обновлении произошло множество изменений как в синтаксисе, так и в функционале. Старые скрипты продолжат работать если указывать в @version=4. А для обновления под 5 версию нужно внести некоторые изменения в код. Подробно обо всем смотри в этом видео.
Стоимость использования Pine Script
Использование Pine Script бесплатно на всех тарифных планах TradingView. На некоторых тарифах вы можете ограничивать публичность скриптов (вероятно для монетизации ваших скриптов).
Ограничения на скрипты
Так как скрипты выполняются на серверах TradingView, то на скрипты могут накладываться ограничения для того чтобы большие и сложные скрипты излишне не нагружали сервера и не мешали работе скриптов других пользователей.
Ограничения могут коснуться:
- количество баров
- времени исполнения скрипта
- объема потребляемой памяти
- размера скрипта
Например количество баров которые мы можем увидеть ограничено 5000 для пользователей бесплатного тарифа (так написано в документации, но по моим наблюдениям это не всегда так  ).
).
Структура скрипта Pine
Пример скрипта можно увидеть в редакторе Pine если выбрать
Открыть —
Новый индикатор ( или Новая стратегия )
Например индикатор может выглядеть вот так :
|
1 2 3 4 5 6 7 8 9 10 11 12 13 14 15 16 17 18 19 20 21 22 23 24 25 26 27 28 29 30 31 32 33 34 35 36 37 38 39 40 41 42 43 44 45 46 47 48 49 50 51 52 |
//@version=5 indicator(«Мой скрипт») plot(close) Некоторые элементы скрипта обязательны, некоторые нет. Ниже пример более сложного индикатора и комментарии которые описывают структуру: //@version=5 // ^^^ директива компилятору какую версию языка использовать // если не указать то будет исп. версия 1 // версия между собой не совместимы // функция аннотация — описывает скрипт // indicator — индикатор // strategy — стратегия // library — библиотека indicator(«Azzrael sample script», overlay=true) // определение функции fn() => // локальные выражения выделяются отступами // строго !!! равными 4 символам или табуляции a = 9 b = a + 3 [a, b] // последняя строка — возвращаемое значение, в данном сл. кортеж // вызов функции [i1, i2] = fn() // выражения можно переносить но ВАЖНО соблюдать правило // перенесенная строка начинается как мин. с 1го пробела, но не с 4 и не с табуляции title = «Третья « + «скользящая» + «значение» // на одной стр можно писать неск выражений разделяя их зпт width = 4, color1 = color.yellow // можно переносить строки и при вызове функций i3 = input(26, title) // ВАЖНО!!! Нельзя вставлять комментарии при переносе строк (кроме последней) // вызов встроенных функций ma1 = sma(close, i1) ma2 = sma(close, i2) ma3 = sma(close, i3) // вызов встроенной функции аннотации plot(ma1, color=color1) plot(ma2, color=color.blue) plot(ma3, color=color.green, linewidth=width) |
Использование либо
indicator либо
strategy , либо
library в скрипте ОБЯЗАТЕЛЬНО.
Отличие indicator или strategy
indicator инициализирует Индикатор, strategy — Стратегию. В PineScript до версии 5 вместо indicator использовалось ключевое слово study.
Индикатор обязан использовать хотя бы одну функцию для вывода информации на график (напр. plot). Стратегия обязана использовать хотя бы одну функцию для совершения сделки (напр. strategy.entry() ).
Стратегия — скрипт предназначенный для совершения сделок. Как в реальном времени так и для тестирования в тестере стратегий TradingView на исторических данных. Стратегия также может что-то выводить на график (например значки о совершенных сделках). Индикатор предназначен для вывода информации на график инструмента и не может совершать сделки, но зато потребляет меньше ресурсов и работает быстрее.
И Стратегия и Индикатор могут создавать Алерты.
Модель работы скриптов Pine
Важно понимать что ваш скрипт выполняется многократно для КАЖДОГО бара начиная с самого старого доступного. При этом индекс “текущего” (самого правого) бара равен 0. По мере работы скрипта он как бы смещается по барам слева направо.
Когда Индикатор достигает текущего, не закрытого ещё бара, то скрипт выполняется каждый тик (при каждом обновлении цены или объема) до тех пор пока бар не закроется. Скрипт выполняется ещё один раз на закрытии бара.
Стратегия по умолчанию считается только по закрытии текущего бара, однако её также можно настроить на пересчет по каждому тику.
Серии
В Pine Script есть важнейший тип данных — Серии. В сериях хранятся например данные баров close, open, high, low и т.д. Серии можно воспринимать как динамический массив. По мере перемещения скрипта по барам серия дополняется значениями.
Серия важнейшее понятие Pine Script. В сериях хранятся все важные данные, серии возвращаются в качестве ответа многих функций технического анализа PineScript. Например ma = ta.sma(close, 14) вернет нам серию значений простой скользящей средней.
Серии могут быть series int, series float, series string. Но серии не могут иметь смешанные типы. В этом серии в PineScript опять напоминают строго типизированные динамические массивы.
С сериями можно совершать некоторые операции. Складывать, вычитать, умножать. В PineScript вы будете постоянно работать с сериями.
Продолжение теории по типам, операндам, операторам возможно будет дополняться в дальнейшем.
Визуализация в PineScript (линии, метки, таблицы)
Визуальный анализ неотъемлемая часть технического анализа. Поэтому в PineScript существует много объектов которые мы можем выводить как в окне графика, так и в окне под графиком. В первую очередь при отрисовки нужно осознать концепцию побарной работы скриптов, о которой я уже упоминал выше. Но более подробно об этом в видео ниже:
Ниже список моих видео посвященных каждому объекту визуализации в PineScript. Я постепенно дополняю этот список снимая новые видео. Все их вы найдете в плейлисте посвященном PineScript на Azzrael Code.
- Линии (line.new) — рисую горизонтальные (но не hline.new) и вертикальные линии
- Метки (label.new) — метки с привязкой к барам
- Заливка фона под баром — как закрасить фон в нужный цвет в зависимости от расчетов
- Заливка произвольной области ограниченной plot или hline
Пересечения цен и линий в PineScript
Часто торговым сигналом является пересечение ценой или индикатором определенного уровня или их взаимное расположение. В PineScript есть простые методы для работы с пересечениями серий — ta.cross, ta.crossunder, ta.crossover. Я подробно рассмотрел их работу в видео:
Alert в Pine Script
Вам может показаться что алерты в TradingView — это банальный инструмент для надоедливых уведомлений, однако это совершенно не так. Благодаря возможности навесить на Alert WebHook, этот инструмент превращается в волшебный мост к вашему брокеру или внешнему инструменту анализа. Мне очень нравятся алерты в TradingView, кроме того что вебхуки доступны только на платных тарифах — это, конечно, печально. Подробнее здесь:
Продолжение следует и сначала все публикуется в видео на канале Azzrael Code! Если интересуешься техническим анализом, Trading View, разными айтишными штуками вокруг инвестиций и трейдинга — ПОДПИСЫВАЙСЯ!
In this pine script tutorial I’ll be showing you how to get started with TradingView scripting for technical analysis and trading strategy development. We will start by looking at how pine script works and a simple example. From there we will move on to inputs and indicators before creating a complete trading strategy using pine script. Finally we will look at how to backtest, execute and publish pine script indicators and strategies.
- Developing Pine Script Trading Strategies [Video]
- How Pine Script Works On TradingView
- Your First Pine Script Overlay
- Pine Script Basics
- Pine Script Built In Functions
- Creating A Pine Script Trading Strategy
- Backtesting Pine Script Strategies
- How & Why Publish TradingView Pine Scripts
- Trade Execution & Strategy Deployment
Developing Pine Script Trading Strategies
Note that Pinescript v4 was used in the video, now Pinescript v5 has been released I’ve updated the code in the article below with the main difference being namespacing i.e. sma becomes ta.sma
How Pine Script Works On TradingView
Pine script is the native coding language of TradingView. It’s used widely for technical analysis and algo trading strategy development.
Pine script is quite similar to Python in it’s format and layout. Developers familiar with Python or any other scripting language shouldn’t have much difficulty getting up to speed. There are some important considerations that need to be addressed before we get started.
Pine script executes once for each candle of a chart on what is known as series data. The code that you write is executed once for each data point in the series data. There might be a thousand data points (1 data point = 1 candle) on a standard chart and the code will iterate over itself each time. So when you call the plot(close) function in pine script it draws a line at the close price for each data point.
When you change the timeframe on the chart the data changes and the indicator or strategy will change completely. A 30 minute moving average is very different to a 30 day moving average and this is normally set on the chart not within the script itself.
There are two types of pine script formats indicators and strategies. Indicators are used for technical analysis to draw lines and patterns on charts. Strategies are used to develop and back test trading strategies. An indicator might be used by a trader looking to better understand the current price movements of a particular asset. A strategy might be developed to take advantage of a particular market movement or opportunity.
The free version of TradingView allows you to have up to 3 indicators on a chart at any one time. There are paid versions available as well. The Pro version allows up to 5 indicators @ $15/month and the Pro+ version up to 10 indicators @ $30/month. The paid versions also have a lot of additional features.
Check the TradingView | Go Pro Page for details on the split-screen/alerts/features and current prices.
Your First Pine Script Overlay
Let’s look at some example code for an indicator to get stuck in.

//@version=5
indicator('First Pine Script', overlay=true)
fast = ta.sma(close, 24)
slow = ta.sma(close, 200)
plot(fast, color=color.new(color.blue, 0))
plot(slow, color=color.new(color.yellow, 0))- The first line declares we are using the latest version 4 of pine script.
- The study function declares it’s an indicator, gives it a name and sets it to overlay rather than add a separate window at the bottom of the chart.
- We then set two variables using the built in sma() function (simple moving average). We set the fast variable to a moving average with a period of 24 and the slow variable to a period of 200. This will look back and calculate the average of the last 24 and 200 closing prices for each data point.
- Finally we use the plot() function to print these on to the chart with different colours.
Try opening up the pine editor, adding this in and then clicking “add to chart”. You should see two lines printed on your chart for the moving averages.
Pine Script Basics
This is half introduction, half cheat sheet to get up to speed as quickly as possible before we go through some more in depth examples. It assumes some basic programming knowledge in other languages.
Pine script at it’s core just takes in time series data, passes that data through functions and outputs it as a strategy or indicator.
Functions can either be user specified or fortunately pine script comes with the vast majority of functions you’ll likely need built in. To get the simple moving average for the last 14 bar closes you can use:
sma1 = ta.sma(close,14)
Data sources or inputs are in the series format and generally available for:
open, high, low, close, volume, time
You can access the previous value in a series using the format:
close[-1]
UPDATE 10th April 2021
Pine script has introduced a new function to allow for variables to be stored between candles. You can now use varip to keep running counts and retain data across each execution or candle:
varip int count = 0
Most indicators will be customisable without digging into the code. This is done by adjusting the inputs using the little cog next to the indicator name (hover mouse over towards the top left of the chart). The code for setting variables based on inputs looks like this:
myInput1 = input(title=”Click To Turn Off”, type=input.bool, defval=true)
myInput2 = input(title=”Chance Of Success(%)”, type=input.float, defval=1, minval=1, step=0.1)
myInput3 = input(title=”Choose An Option”, defval=”A”, options=[“A”, “B”, “C”])
As default pine script will execute at the close of every candle as opposed to on each tick or price movement. To change this set the following:
calc_on_every_tick=true
Alerts can be used to send a notification or to send trades to an external API. Paid plans come with server-side alerts which can be setup to send out a message without needing to be logged in.
alert(“Wake Up”, alert.freq_once_per_bar_close)
The following data types are available:
int = integer or whole number
float = number with decimal point
bool = boolean (true or false)
color = a standard color which we use a RGBA (red, green,blue,alpha) hex format similar to CSS #FF003399
string = a line of text
line = a line on a chart
hline = a horizontal line on a chart
plot = a line or diagram on a chart
array = a data format like [“a”,”b”,”c”]
Standard operators include:
+ – * / % < <= >= > == != not and or
These can be used in statements which use a double space indented layout:
if close >= open
doSomething()
Statements can be combined and used in line. This is useful when adding filters and you want to check multiple attributes before executing a trade:
FilterOK = false
Filter1 = close > open
Filter2 = rising(volume,1)
FilterOK := Filter1 and Filter2
You can plot a line by specifying the price and any options
plot(priceVariable, color=color.yellow)
You can place a shape on a chart using the plotShape() function:
plotshape(true, style=shape.flag, color=test ? color.green : color.red)
Shapes available are:
shape.xcross, shape.cross, shape.circle, shape.triangleup, shape.triangledown, shape.flag, shape.arrowup, shape.arrowdown, shape.square, shape.diamond, shape.labelup, shape.labeldown
If you want to access or round then you’ll often want to use the current tick size for the data set which is stored in:
syminfo.mintick
Pine Script Built In Functions
Pine scripts built in functions are great and make testing and developing strategies quicker and more efficient. There are hundreds of built in functions but these are the ones I find most useful when developing strategies.
Standard Built In Functions
These are standard functions that you’ll be using a lot to when developing in pine script. For the most part you pass in data and a resulting value is passed back.
five = sqrt(25)
| Function | Description |
|---|---|
| sqrt(9) | Square root of a value |
| log(5) | Logarithm of a value |
| round(54.23) | Rounds a float to the nearest integer => 54 |
| min(val1, val2, val3) | Returns the lowest value |
| max(val1, val2, val3) | Returns the highest value |
| crossover(ema1,ema2) | Given two data series it calculates a boolean as to if they crossed over in the most recent data point. |
| crossunder(ema1,ema2) | As above but if ema1 has crossed underneath ema2 |
| cross(ema1,ema2) | As above but returns true if over or under |
| valuewhen(crossover(slow, fast), close) | Get value of close when a crossover or other occurrence takes place |
| strategy.entry(“long”, strategy.long, 100, when=strategy.position_size <= 0) | Enter a trade with a long position for 100 units when conditions such as this position size is met. |
| strategy.exit(“exit”, “long”, stop=stopLoss, limit=takeProfit) | Exit a trade based on a stop loss or take profit value |
| label.new(bar_index, high, syminfo.ticker) | Labels can be used to print data at a specific data point |
| tokyoOpen = time(timeframe.period, “0000-0800”) bgcolor(na(tokyoOpen) ? na : color.green) |
You can set background colours for specific time periods on a chart based on UTC timezone. |
| myColor = color(#800080,0) | Set a custom colour to a variable using hex format |
| teslaClose = security(“TSLA”, “D”, close) | Data is generally set to a single asset or market such as BTCUSD for the Bitcoin US Dollar market. You can call in other data sources to look for correlations and betas with |
| nz(ema1, ema2) | Replaces NaN values with zeros to clean up data in a series. |
Time Series Built In Functions
These are slightly different functions that you can use to pass in series data such as the daily close or high and a data length or look back period to calculate a moving average or some other value based on that data.
topPriceExample = highest(close,5)
| Function | Description |
|---|---|
| change(close,5) | Difference between current value and previous. Example will show difference between current closing price and the closing price five candles back. |
| highest(open,10) | Highest value for a set number of bars |
| lowest(open,10) | Lowest value for a set number of bars |
| linreg(low,30) | Linear regression curve. A best fit line for a specified time period. A linear regression curve is calculated using the least squares method. |
| mom(close,7) | Momentum or the difference between price and price however many bars ago. |
| sma(high, 300) | Simple moving average. The mean average of the values for a set period. |
| sum(close, 5) | The sum of the last x values |
| vwma(close, 21) | Volume weighted moving average |
| wma(close, 21) | Weighted moving average |
| ema(close, 21) | Exponential moving average. Moves faster than the sma and more useful. |
| atr(14) | Average true range displays the average trading range between high and low for however many candles. This is useful for gauging market conditions and setting stops. |
| variance(close, 20) | Variance calculates the squared deviation of series data from its mean average |
| stdev(close, 20) | Standard deviation for series data for a set period |
| correlation(sourceA, sourceB, 200) | Shows the correlation coefficient for two assets to deviate from the simple moving average. |
| vwap(close) | Volume weighted average price. Used a lot by market makers and institutional traders |
| rsi(close,14) | Relative strength indicator. A measure of how over bought or over sold an asset is. |
Creating A Pine Script Trading Strategy
OK now everyone is up to speed let’s get started with create a basic moving average cross over strategy.
//@version=5
strategy('Pine Script Tutorial Example Strategy 1', overlay=true, initial_capital=1000, default_qty_value=100, default_qty_type=strategy.percent_of_equity)
fastEMA = ta.ema(close, 24)
slowEMA = ta.ema(close, 200)
goLongCondition1 = ta.crossover(fastEMA, slowEMA)
timePeriod = time >= timestamp(syminfo.timezone, 2020, 12, 15, 0, 0)
notInTrade = strategy.position_size <= 0
if goLongCondition1 and timePeriod and notInTrade
    stopLoss = low * 0.97
    takeProfit = high * 1.12
    strategy.entry('long', strategy.long)
    strategy.exit('exit', 'long', stop=stopLoss, limit=takeProfit)
plot(fastEMA, color=color.new(color.blue, 0))
plot(slowEMA, color=color.new(color.yellow, 0))- So we start by setting the pine script version and a name for our strategy and setting overlay=true to put any drawings on top of the chart. Note that we use the strategy function instead of the study function to define a strategy.
- We set the initial capital to $1000 and default quantity to 100% of capital for backtesting within this strategy() function.
- We then move on to calculate a fast (24 candle) and slow (200 candle) exponential moving average. This is going to be using the hourly time frame so we have an average 24hr price and a average 200hr price.
- The goLongCondition1 variable is set to true or false depending if there is a cross over of the fast and slow moving averages
- This is a trend following strategy so I only want to test it from the start of the most recent bull run. We set the sinceBullRun variable to true if the date is later than the 15th December 2020
- We set notInTrade to true if we are not currently in a trade using the strategy.position_size built in variable
- if goLongCondition1, timePeriod and notInTrade are all true, we continue to the indented code
- A stop loss is set to 3% below the hourly low, a take profit is set to 12% above the daily high
- strategy.entry is used to take out a long position effectively purchasing the underlying asset.
- strategy.exit is used to set the previously declared stopLoss and takeProfit levels
- Finally we will plot the fastEMA and slowEMA values on the chart so we can better visualise what the strategy is doing.
Backtesting Pine Script Strategies
So how does this simple moving average cross over strategy perform? When lambo? To find out we use TradingView’s StrategyTest application.
Go in to TradingView and search for asset BTCUSD, set the time frame to 1 hour, copy and paste the strategy from the previous example, click “Add To Chart”, then go into the StrategyTest tab and you should be presented with something like this:

As you can see this is performing quite well. We have a net profit of 35% which is not to be sniffed at. However when you compare it to a buy and hold strategy which returns over 50% it’s starting to look less optimal.
Using the chart you can see that there’s large sections of this bull run where we don’t have exposure and it’s taking out positions at points where we are getting stopped out quite frequently.
So what can we do to improve this strategy?
The first thing I would do is get it to execute trades whenever we are above the slow moving average rather than rely on a specific cross over point. We effectively want to be long when Bitcoin is trending up and then sell at the first signs of trouble but without getting stopped out so frequently that the strategy gets chopped to pieces.
I would also add a second condition to both the entry and exit. We want the market momentum to be in our favour whenever executing a trade and we don’t want to exit a position if it’s already turned and trending back up. One simple trick I’ve found works quite effectively for this is comparing the simple moving average with the exponential moving average for the same period. The exponential moving average puts more weight on recent data so when compared to the sma which is just the mean, it will therefore show the most recent market direction.
The other thing I’d modify is the stop-loss, to use average true range rather than a fixed percentage which will be more dynamic in volatile conditions. Let’s take a look at what this modified code looks like:
//@version=5
strategy('Pine Script Tutorial Example Strategy 2', overlay=true, shorttitle='PSTES2', initial_capital=1000, default_qty_value=100, default_qty_type=strategy.percent_of_equity, commission_value=0.025)
fastPeriod = input(title='Fast MA', defval=24)
slowPeriod = input(title='Slow MA', defval=200)
fastEMA = ta.ema(close, fastPeriod)
fastSMA = ta.sma(close, fastPeriod)
slowEMA = ta.ema(close, slowPeriod)
atr = ta.atr(14)
goLongCondition1 = fastEMA > fastSMA
goLongCondition2 = fastEMA > slowEMA
exitCondition1 = fastEMA < fastSMA
exitCondition2 = close < slowEMA
inTrade = strategy.position_size > 0
notInTrade = strategy.position_size <= 0
timePeriod = time >= timestamp(syminfo.timezone, 2020, 12, 15, 0, 0)
if timePeriod and goLongCondition1 and goLongCondition2 and notInTrade
    strategy.entry('long', strategy.long, when=notInTrade)
    stopLoss = close - atr * 3
    strategy.exit('exit', 'long', stop=stopLoss)
if exitCondition1 and exitCondition2 and inTrade
    strategy.close(id='long')
plot(fastEMA, color=color.new(color.blue, 0))
plot(slowEMA, color=color.new(color.yellow, 0))
bgcolor(notInTrade ? color.red : color.green, transp=90)- I’ve also added a commission value of 0.025 in the strategy set up at the top to allow for trading fees.
- I’ve added customisable fastPeriod, slowPeriod values for the moving averages using the input() function.
- And I’ve changed the background colour in the last line to display red or green depending on if we are in a trade or not.
Copy and paste this into TradingView with the 1HR BTCUSD chart and it will look something like this:

This is much more like how I would want to trade this market moving forwards. You can see from the green and red backgrounds that we are capturing the majority of the upwards momentum and avoiding some of the down trends. But more importantly it closes the position early enough so that if there was a big crash we wouldn’t lose the farm.
The return is 194% which is just slightly above a buy and hold strategy. I’d expect in production it would be roughly equal or even below a buy and hold strategy if the market continues rising. This is because the algo has been shaped, to a certain extent, by past data.
The Sharpe ratio however is improved because the risk adjusted returns on this type of strategy has improved. This strategy gives you exposure to Bitcoin gains in a trending market and gets you out before any major market crashes, where were you in 2017-18?! 😒. There’s a lot of value in capturing gains while avoiding major downturns which fitted moving average strategies aim to realise.
As soon as the market dips beyond the 200hr moving average line the position is closed preserving capital. This is exactly what I want during the mid to later stages of a parabolic bull market. If the market stopped trending up and started moving sideways for a significant amount of time this strategy would get destroyed. You’d be effectively buying high and selling low, a mean reversion strategy would be much more appropriate in that type of market conditions. In fast trending markets though this provides a simple but effective, risk-averse, trend following trading strategy.
Here are some more example code snippets that can be used to filter trades and develop strategies.
// Open Trade Filters
openCondition1 = (ta.rsi(close,14) > 40)
openCondition2 = ((strategy.closedtrades - strategy.closedtrades[24]) < 1)

// Exit Conditions
exitCondition1 = ta.ema(close, 50) < ta.ema(close, 200)
exitCondition2 = close < close[1] * 0.95
if exitCondition1 or exitCondition2
    strategy.close(id='long')

// Smoothing
smoothed = close + 0.5 * (close[1] - close)

// Adaptive Colors
line_color = color.green
if close < close[1]
    line_color := color.red
    line_color
plot(close, color=line_color)
bgcolor(line_color, transp=90)
How & Why Publish TradingView Pine Scripts
To publish a script publicly it needs to be original, useful and it needs a good description to let other traders understand what it is. This is an except from the TradingView documentation:
“Your script’s description is your opportunity to explain to the community how it is original and can be useful. If your description does not allow TradingView moderators to understand how your script is original and potentially useful, it will be moderated.”
My moving average script wouldn’t be approved because there are already a million and one other scripts just like it in the public library. This brings me to an important point about expectations for public work.
If someone has a low time frame delta neutral strategy that is consistently profitable they aren’t going to publish it, they aren’t going to sell it and they aren’t going to need your money to execute it. Things like that do exist but they are rare, extremely hard to create, don’t last forever and are highly profitable.
If someone had a strategy that makes just 5% a day consistently they could generate a return of $50 billion from an initial investment of $1000 in a year. This is obviously unrealistic and what’s more unrealistic is that they’ll sell you this strategy for just $19/month.
Having said that there are some very smart developers who publish open source algorithms. I think there is value in reviewing others work and then incorporating their ideas and methods in your own strategies and algos.
The collaboration and industry acknowledgement aspect is why many algorithms which could be successful in specific market conditions are published. There is a community of traders who use TradingView regularly and publishing original work which adds value can be beneficial to the developer and the community.
If you would like to publish your work you can click on the “Publish Script” tab within pine editor which will bring up the following interface:

Trade Execution & Strategy Deployment
TradingView has a broker panel where you can connect your account directly to one of the following brokers:
- Oanda
- TradeStation
- Gemini
- Capital.com
- FXCM
- Saxo
TradingView is great for visualising and developing trading strategies but for execution, in my opinion, we need something more robust. If the markets get busy and TradingView goes down we need our strategies to still execute.
For this reason I’d recommend migrating pine script over to either NodeJS or Python and executing via official exchange/broker API’s. Production code can be executed on a dedicated server (with a fallback server if volume permits it) to provide complete control over the process.
On a high timeframe strategy where execution efficiency doesn’t matter too much then it could well be possible to work with one of the brokers above but most quant traders will run their own bots and this is the approach I’d recommend.
If I wanted to execute the strategy discussed above I wouldn’t actually want all my funds on an exchange account buying and selling spot BTC. I would probably flip the strategy so that it opened a short position on a perpetual futures trading contract whenever the price fell below the 200hr moving average and other filters were met.
This would in effect hedge my current long position with a leveraged trade so that I’d only need to keep a reduced amount of capital on exchange for collateral. The rest of my funds could be held in a cold storage wallet and trade them only to balance out the position by closing the perp and selling spot at a later date.
So for example if my cryptocurrency portfolio had 1BTC and 20ETH in it I’d add 5 ETH and 0.25 BTC to an exchange like FTX to use as collateral. I’d then use an API to execute a leveraged short position for 1BTC and 20ETH whenever the strategy dictated.
This is what the code for something like that would look like:-
const request = require('request');
const crypto = require('crypto');
const ftx = require('lib/exchanges/ftx.js');

const account = {
  apiKey: `abc123`,
  apiSecret: `abc345`,
  subAccount: `HEDGE1`,
  inTrade: false,
}

const calculateSMA = (arr, range=false) => {
  if (!range) range = arr.length;
  let sum = 0;
  if (range > arr.length) range = arr.length;
  for (let ii = arr.length - range; ii < arr.length; ii++){
    sum += arr[ii];
  }
  return sum / range;
}

const calculateEMA = (arr,range=false) => {
  if (!range) range = arr.length;
  const yma = arr.reduce((p,n,i) => i ? p.concat(2*n/(range+1) + p[p.length-1]*(range-1)/(range+1)) : p, [arr[0]]);
  return yma[yma.length-1];
}

const checkStrategy = async () => {
  const res1Promise = fetch(`https://ftx.com/api/markets/BTC-PERP/candles?resolution=3600&limit=200`).catch(err => utils.errorLog(err));
  const res1 = await res1Promise;
  const ftxCandles = await res1.json().catch(err => utils.errorLog(err));
  const priceArray = [];
  ftxCandles.result.forEach((min,i) => {
    priceArray.push(min.close);
  });
  const fastEMA = calculateEMA(priceArray.slice(-24));
  const fastSMA = calculateSMA(priceArray.slice(-24));
  const slowEMA = calculateEMA(priceArray.slice(-200));
  const hedgeCondition1 = (fastEMA < fastSMA);
  const hedgeCondition2 = (fastEMA < slowEMA);
  if (hedgeCondition1 && hedgeCondition2 && account.inTrade === false) {
    account.inTrade = true;
    ftx.Order('SELL', 'BTC-PERP', 1, fastEMA * 0.95, account);
    // Send an alarm notification and do logic to confirm trade went through
  }
}

setInterval(() => {
  checkStrategy();
}, 60000);
This is untested and nowhere near production ready but it provides a couple of useful JavaScript functions for calculating simple and exponential moving averages. It also shows how you can grab live data from an exchange and use this to make trading decisions.
In production I would have infrastructure like this set up.

Check the TradingView | Go Pro Page
Блог им. MoonMan
- 04 ноября 2021, 18:35
- |
Часто вижу на форуме вопросы типа «Как написать простого робота, чтобы автоматизировать торговлю?». Несколько раз отвечал, а сегодня делать нечего и решил в одном посте соединить всё воедино, надеюсь пригодится начинающим писателям скриптов. Если коротко: не занимайтесь написанием роботов, всё что вам нужно для успешной торговли уже реализовано в TradingView: рисуете на графике области, линии тренда и прочие фаллосы. Далее создаёте уведомление, например на выход из области или пересечение линии тренда или на закрытие выше линии или на любое другое событие которых в TV огромное количество. TV позволяет на уведомление повесить webhook, то есть может «дёргать» внешний скрипт. Арендуете сервер с внешним IP адресом (далее IP_сервера) и пишете элементарный скрипт, который делает «продать всё по рынку» или «продать всё по цене, которую передал TV» и т. д. Таким образом вся логика у Вас будет на графике, любые сценарии программируются за 5 минут наглядно рисованием.
А теперь скрипты и примеры их использования:
Webhook скрипт на PHP для фонда (на примере Тинькова): https://telegra.ph/webhookListenerTinokphp-11-04
Для него требуется установить в папку со скриптом с помощью composer пакет github.com/jamesRUS52/tinkoff-invest, запуск скрипта на сервере из консоли командой php -S IP_сервера:80 ./webhookListenerTinok.php
Замечание: в TIAccountId можно вписать идентификатор нужного счёта если их несколько (например брокерский и ИИС), lot нужно указывать только для валютных пар.
Webhook скрипт на PHP для крипты (на примере Binance): https://telegra.ph/webhookListenerCryptophp-11-04
Для него требуется скачать архив github.com/ccxt/ccxt и кинуть в папку со скриптом, запуск на сервере из консоли командой php -S IP_сервера:80 ./webhookListenerCrypto.php
Замечание: binance в конфиге можно заменить на любую другую биржу, поддерживаемую ccxt.
Крайне важно ограничить доступ к скриптам по белому списку IP адресов (только серверы TV). На 04.11.2021 это 52.32.178.7, 54.218.53.128, 34.212.75.30, 52.89.214.238. Можно вставить проверку в скрипты, но в примерах выше они вызываются через встроенный веб сервер PHP, открытые порты через некоторое время начнут долбить всякие боты…
Пример использования для крипты:
Если с 04 по 08 ноября закрываемся на дневках выше 4600 — купить эфир по рынку
В TV переходим на интервал 1Д, рисуем линию тренда на 4600 с 04 по 08 ноября:

Кликаем правой кнопкой по нарисованной линии — Добавить оповещение для Линия тренда…

Устанавливаем условия, жмём На закрытии бара, ставим галку URL веб-хука, в поле ниже пишем IP_сервера, жмём кнопку Больше и в поле Сообщение вписываем текст «ETHUSDT buy MARKET».
Рекомендую сначала всё вписать и сразу (до сохранения) снять галку URL веб-хука, сохранить уведомление. Если уведомление сразу не сработало — молодец, можно отредактировать — поставить галку. Первое время они будут часто срабатывать сразу после их создания
Поле Сообщение имеет вид «ТИКЕР КОМАНДА ПАРАМЕТР«, где КОМАНДА — это buy или sell, а ПАРАМЕТР — это MARKET или числовое значение, можно использовать встроенные переменные TW, такие как {{close}} — цена закрытия бара? {{open}}, {{high}}, {{low}} и возможно другие.
Использование webhook для Тинькова точно такое же, в поле Сообщение пишем «GAZP sell 999.99» или «AAPL buy 100». А ещё можно рисовать на одних графиках, а торговать совсем другие инструменты, можно прикрутить лоты, можно сделать переворот, можно использовать встроенные стратегии TV…
Послесловие: это не реклама, выложил то, чем пользуюсь сам. Идея и скрипты предоставлены по принципу «it works for me», не несу никакой ответственности за их работу или не работу у кого-либо. На вопросы «почему PHP?» или «почему не запускается веб сервер и вообще так всё криво реализовано?» отвечать не буду, на вопросы «как запрограммировать с помощью этого барахла мою идею?» отвечу. Если есть интересные проекты, связанные с криптой, торговыми роботами или просто подискутировать на связанные темы — пишите.
- хорошо
-
43
Last Updated on July 16, 2022
This article has been updated for Pine Script V5.
Table of Contents
- What is Pine script?
- Why should I use Pine script?
- Why shouldn’t I use Pine script?
- What are the alternatives to using Pine script?
- How do I get started with Pine script?
- How to retrieve the price of Apple in Pine script?
- How to retrieve the SMA(20) of Apple in Pine script?
- How to backtest a moving average cross strategy with Pine Script?
- How to set take profits and stop losses?
- How to fire a trade on Apple when Google moves 5%?
- How to modify our scripts without coding?
- How to Plot with Pine script?
- How can I create a custom indicator with Pine script?
- Final Thoughts
What is the Pine script?
Pine script is a programming language created by TradingView to backtest trading strategies and create custom indicators.
Pine script was designed to be lightweight, and in most cases, you can achieve your objectives with fewer lines of code compared to other programming languages.
It is not based on any particular language, but if you’ve used Python, you’ll tend to pick it up quickly and notice similarities.
Pine script code can be created within Pine editor which is a part of TradingView’s online charting platform.
Why should I use Pine script?
Built-in Data – This is a big one. Testing strategies or creating indicators in other languages involves sourcing your own data.
Not only does that mean you have to find a place to grab your data from, but you’ll also then have to format it in a certain way and this whole process can be time-consuming.
TradingView has a plethora of data available at your fingertips, ready to access with as little as one line of code.
Easy to Learn – Pine script syntax is readable and simpler than other programming languages.
Also, you don’t have to spend much time on error checking and handling as TradingView takes care of most of that for you.
Extensive user base and library – TradingView users have the option to publish their indicators and strategies to the TradingView library.
Having access to open-source code is a great way to learn from other programmers. Also, in some cases, someone else may have already written the code for what you’re after.
» Quantopian has shut down. An alternative to consider is QuantConnect.
QuantConnect is a browser-based backtesting and algo trading platform.
Link: QuantConnect – A Complete Guide
Content Highlights:
- Create strategies based on alpha factors such as sentiment, crypto, corporate actions and macro data (data provided by QuantConnect).
- Backtest and trade a wide array of asset classes and industries ETFs (data provided by QuantConnect).
- License strategies to hedge fund (while you keep the IP) via QuantConnect’s Alpha Stream.
Why shouldn’t I use Pine script?
The main reason why you wouldn’t want to use Pine script is that you’re limited to the TradingView universe.
Here are some specific limitations –
Data – If TradingView does not offer the data you’re after, you’re out of luck.
Granted, TradingView has a very comprehensive database of data feeds. But if your strategy involves trading obscure markets, price data may not be available.
This extends outside of price data. Some strategies involve economic or statistical data. TradingView does offer some data (mainly Quandl data) in this category but it is limited at this time.
If you use alternative data in your strategy, it’s probably easier to use another programming language that offers more flexibility.
External libraries – Pine script is not appropriate if you’re looking to leverage external libraries to do things like Machine learning.
There are better alternatives if your strategy relies on using data science or other third-party libraries.
What are the alternatives to using Pine script?
TD Ameritrade’s thinkorswim – this platform has a lot of similarities to Pine Script.
It utilizes a proprietary language called thinkScript and stores price data in arrays in a similar way to Pine script.
Data is built-in and the platform is geared toward creating custom indicators and strategies.
Ninjatrader – This platform also uses a proprietary language which is called Ninjascript. The language is not completely proprietary as it is based on C#.
Ninjatrader has a bit more flexibility as it allows you to connect to custom data feeds.
If you’re already familiar with C#, C, or C++, this might be a viable alternative.
How do I get started with Pine script?
Getting started with Pine script is really simple, there is nothing to download or install.
If you already have an account with TradingView, simply head over to their page.
If you don’t have an account, navigate to www.tradingview.com. From there you will see a sign-in box in the upper right-hand corner.
There are several one-click options to sign up, or use the traditional email/password method.
Having an account allows you to save your scripts to the TradingView cloud, and provides the ability to add custom indicators to your charts.
Once signed up, launch the charting platform either by clicking on chart in the menu or by navigating to www.tradingview.com/chart
A first look at Pine editor
Pine editor is where we will be creating our code. To launch it, click on Pine Editor on the very bottom of your screen.
A screen should pop up that looks like the image below.
In Pine script, you will either be creating an indicator or a strategy. We will discuss the differences extensively in this article.
If you’re following along, the screen you’re looking at now is the default starting script to create an indicator.
Let’s run through it line by line.
// This source code is subject to the terms of the Mozilla Public License 2.0 at https://mozilla.org/MPL/2.0/The first line is simply a comment. Comments in Pine script start with two forward slashes.
// © authorThe second line is also a comment, it is auto-populated with your TradingView user name.
//@version=5On the fourth line, you might assume we have yet another comment. However, this line is a bit different.
This is known as a compiler directive. It lets the compiler know which version of Pine script we want to use.
You can forego the first two comment lines if you want, but the compiler directive is required in all scripts.
indicator("My Script")Line 5 is a declaration. This is where you specify if you are creating an indicator.
The alternative is to create a strategy, but we will start with the indicator.
The second part of Line 5, in quotation marks, is the name that we will assign for this particular indicator. The default is My Script.
plot(close)Line 6 contains the plot command. As you may have guessed, this tells TradingView to plot a specific variable.
In this case, the variable close will get plotted. This is a built-in variable that contains the closing price of the latest bar.
Let’s hit Add to Chart on the upper right of the Pine editor.
You will be prompted to save the script.
Once saved, your chart should have a new window that contains a plot of the closing prices from your main chart.
This window is called the data window. In the image above, this is the line chart that is drawn in blue.
Note that the data window shows “My Script” in the upper left-hand corner. This pulls whatever is entered into Line 5 of our code where we declared a name for the indicator.
And there you have it, our first indicator and we didn’t even need to write any code!
How to retrieve the price of Apple?
In our first example, we plotted the closing price. Pine script will automatically do that for whichever chart you have open.
In this case, we had a daily chart of Bitcoin open.
But what if you want to get data for another asset? Let’s go through an example where we grab the price of Apple even though we don’t have its chart open.
Every script will start with a few lines where we set the compiler directive. We also indicate if it’s an indicator or strategy that we are creating, and assign a name.
//@version=5
indicator("price of Apple")
In this case, we are creating an indicator. The name of this indicator is “price of Apple”.
Next, we have to tell Pine Script that we are interested in an asset other than what is currently displayed on the chart.
To do this, we can use the request.security() function.
request.security()A nice feature of Pine script is that help is always easily available if you’re working with the syntax you haven’t worked with before.
For example, we can hover over our function and it will show a brief description.
For more detailed information, you can launch a help window. To do this, hit CTRL while clicking on the function on a PC. Or, on a Mac, press CMD while clicking on the function.
The help function clarifies the syntax and even has helpful examples.
request.security("AAPL", "D", close)We’ve used syntax similar to the example in the above code snippet. The first value in the security function is the ticker symbol which is AAPL.
Then we set the time frame to daily. And lastly, we told Pine script we are interested in the closing price.
We can save the return of the function to a variable.
apple_price = request.security("AAPL", "D", close)Now the apple_price variable will contain the latest daily close of Apple’s stock.
Studies created in Pine script need to have at least one output, otherwise, the script will generate a compiler error.
Let’s plot our variable so that it satisfies the Pine script rule about having an output.
plot(apple_price)After saving and adding to the chart, this is what our screen looks like.
We now have Apple’s daily closing price plotted in the data window while the main window is showing a candlestick chart of Bitcoin.
Full Code:
//@version=5
indicator("price of Apple")

apple_price = request.security("AAPL", "D", close)

plot(apple_price)
How to retrieve the SMA(20) of Apple?
Now that we can access Apple’s stock price, let’s go through an example of retrieving a simple moving average.
The same process can be used to apply any indicator.
We will start with our basic declarations and use the security function we created in our last example.
//@version=5
indicator("Get 20 SMA of Apple")

// Get price of Apple
apple_price = request.security("AAPL", "D", close) // 1 Day
If you’re not looking to get the 20 SMA specifically for AAPL, you can skip the security definition and just use the built-in close variable.
This will grab the closing price for whichever security you have showing in your main chart window.
There is a helper function for the SMA indicator built-in to Pine script. To access it, we simply use the ta.sma() function.
ta.sma(apple_price, 20)The first parameter we need to pass in is the price value. In this case, we are using the closing price for Apple that we have stored in our apple_price variable.
The second parameter is the length of the SMA. We are looking for a 20-period SMA.
Lastly, we will assign the SMA data to a separate variable and then plot it.
apple_sma = ta.sma(apple_price, 20)

plot(apple_sma)
The simple moving average for Apple is now plotted to our data window.
Moving averages are typically plotted on the main chart. We can achieve that with a slight modification in our code.
indicator("Get 20 SMA of Apple", overlay=true)By adding in overlay=True into the indicator declaration, we can plot our data directly into the main charting window as opposed to the data window.
Full Code:
//@version=5
indicator("Get 20 SMA of Apple", overlay=true)

// Get price of Apple
apple_price = request.security("AAPL", "D", close) // 1 Day

// Calculate 20 SMA of Apple
apple_sma = ta.sma(apple_price, 20)

plot(apple_sma)
How to backtest a moving average cross strategy with Pine Script?
We’ve gone over indicators. Let’s take a look at strategies in Pine Script.
In the next example, we will create a moving average cross-over strategy with a few additional parameters. We will then backtest the strategy within TradingView.
//@version=5
strategy("My Strategy", overlay=true)
To create a strategy, we swap out the indicator declaration with a strategy declaration.
// Create Indicator's
shortSMA = ta.sma(close, 10)
longSMA = ta.sma(close, 30)
The first thing we will want to do is create two moving averages and assign the data to variables.
rsi = ta.rsi(close, 14)We will also create an RSI indicator that will be used to confirm our entries and exits.
This strategy will be run on the main chart so we don’t need to use the security() function here.
Next, we want to specify our crossover conditions. Fortunately, TradingView has a built-in function for that already, so we don’t need to code it manually.
// Specify crossover conditions
longCondition = ta.crossover(shortSMA, longSMA)
shortCondition = ta.crossunder(shortSMA, longSMA)
We have two conditions, the first one is when the short SMA, the 10-period, crosses above the longer 30-period SMA.
The second condition is the opposite as we’ve used the crossunder function as opposed to crossover.
Both these conditions are saved to variables. So when the crossover or crossunder occurs, these variables will get updated to True which is a Boolean value.
We can use an if statement to check if the condition is changed to True, and then execute a trade based if that is the case.
if (longCondition)
    strategy.entry("long", strategy.long, 100, when = rsi > 50)
The built-in strategy.entry function is used to enter trades. Here are the parameters that are passed into the function.
- “long” – this is a trade ID. We won’t be using it in this example. But, if you plan to close or cancel a trade, it can be done with this ID.
- strategy.long – this is a built-in variable that tells Pine script that we want to get long.
- 100 – the number of shares we want to trade
- when = rsi > 50 – this is an additional parameter that tells pine script to only execute the trade if the RSI is higher than 50.
The syntax for our short entries will follow a very similar format.
if (shortCondition)
    strategy.entry("short", strategy.short, 100, when = rsi < 50)
Since we are running a strategy, we don’t have to plot anything or specify an output.
But we will do so anyway. It would be nice to see the SMA’s on the chart so that we can confirm that trades took place when they should have.
// Plot Moving Average's to chart
plot(shortSMA)
plot(longSMA, color=color.black)
If we save and add to chart, the strategy will run and automatically open the Strategy Tester window which will display some important stats.
This is what our screen looks like.
By default, a new tab opens showing the overview stats for the strategy. You can click through the Performance Summary or List of Trades to see other statistics.
The strategy will run on the time frame that is displayed on your chart.
You can easily cycle through different time frames using the time frame options in the menu at the top of the screen. The strategy will auto-update based on the new time frame chosen.
Full Code:
//@version=5
strategy("My Strategy", overlay=true)

// Create Indicator's
shortSMA = ta.sma(close, 10)
longSMA = ta.sma(close, 30)
rsi = ta.rsi(close, 14)

// Specify crossover conditions
longCondition = ta.crossover(shortSMA, longSMA)
shortCondition = ta.crossunder(shortSMA, longSMA)

// Execute trade if condition is True
if (longCondition)
    strategy.entry("long", strategy.long, 100, when = rsi > 50)

if (shortCondition)
    strategy.entry("short", strategy.short, 100, when = rsi < 50)

// Plot Moving Average's to chart
plot(shortSMA)
plot(longSMA, color=color.black)
How to set take profits and stop losses?
In our last example, the trade execution was determined by moving average crossovers and crossunders.
We will build on this script and set specific stop losses and take profits. We can use the Average True Range (ATR) to calculate the levels for these.
The ATR indicator calculates the average movement over the last number of specified bars. This is a good way to account for changes in volatility.
We have already declared several indicators, we will add the ATR indicator to the list.
// Create Indicator's
shortSMA = ta.sma(close, 10)
longSMA = ta.sma(close, 30)
rsi = ta.rsi(close, 14)
atr = ta.atr(14)
Under our trade conditions, we can make the necessary calculations for our stop loss and take profit.
if (longCondition)
    stopLoss = low - atr * 2
    takeProfit = high + atr * 2
    strategy.entry("long", strategy.long, 100, when = rsi > 50)
    strategy.exit("exit", "long", stop=stopLoss, limit=takeProfit)
In the code above, we calculated the stop loss by taking the low of the bar at the time of entry and subtracting the average true range multiplied by two.
So if the stock moves on average $5 per bar, we are setting our take profit $10 below the low.
A similar calculation is done for the take profit.
Lastly, we specify the exit condition using the strategy.exit() function. Here are the parameters that were passed through.
- “exit” – this is the trade ID for exiting out of the trade.
- ‘long” – this is the ID that we previously set when we entered the trade. This will let Pine script know which position we are trying to exit.
- stop=stopLoss – we are specifying that the level contained in the stopLoss variable should be used as a stop order to exit the trade.
- limit=takeProfit = we are specifying that the level contained in the takeProfit variable should be used as a limit order to exit the trade.
The syntax for our short condition is similar although some of the calculations are slightly different.
if (shortCondition)
    stopLoss = high + atr * 2
    takeProfit = low - atr * 2
    strategy.entry("short", strategy.short, 100, when = rsi < 50)
    strategy.exit("exit", "short", stop=stopLoss, limit=takeProfit)
The rest of the script remains unchanged from the prior example. Let’s run it and see how our strategy did.
Our exits are working and being plotted on our main chart along with the long and short entries.
Full Code:
//@version=5
strategy("Take profits & stop losses", overlay=true)

// Create Indicator's
shortSMA = ta.sma(close, 10)
longSMA = ta.sma(close, 30)
rsi = ta.rsi(close, 14)
atr = ta.atr(14)

// Specify crossover conditions
longCondition = ta.crossover(shortSMA, longSMA)
shortCondition = ta.crossunder(shortSMA, longSMA)

// Execute trade if condition is True
if (longCondition)
    stopLoss = low - atr * 2
    takeProfit = high + atr * 2
    strategy.entry("long", strategy.long, 100, when = rsi > 50)
    strategy.exit("exit", "long", stop=stopLoss, limit=takeProfit)

if (shortCondition)
    stopLoss = high + atr * 2
    takeProfit = low - atr * 2
    strategy.entry("short", strategy.short, 100, when = rsi < 50)
    strategy.exit("exit", "short", stop=stopLoss, limit=takeProfit)

// Plot Moving Average's to chart
plot(shortSMA)
plot(longSMA, color=color.black)
How to fire a trade on Apple when Google moves 5%?
We’ve seen that the security function can be used to display data for stocks not shown on the screen.
We will use it to create a strategy that will execute a trade in Apple if Google moves more than 5%.
This is a mean reversion strategy, so if Google rallies by more than 5%, we will short Apple. If Google falls by more than 5% then we can buy Apple.
The first thing we will do is store Google’s daily open and closing price into a variable.
//@version=5
strategy("Pair Trade: Apple & Google")

google_close = request.security("GOOG", "D", close)
google_open = request.security("GOOG", "D", open)
We can then perform a calculation to determine the percentage price change.
price_change = google_close / google_openThe price_change variable now holds the calculation. So for example, if Google opened at $100 and rallied 5% to close at $105, the price_change variable would be 105/100 which is 1.05.
But if Google opened at $100, and declined 5% to close at $95, the variable would read 95/100 which is 0.95.
So we know that if Google declined 5% or more, the price_change variable would be 0.95 or less, and we want to get long. Here is the syntax to do that.
if price_change < 0.95
    strategy.entry("long", strategy.long, 100)
And the syntax to get short if Google rallies more than 5%.
if price_change > 1.05
    strategy.entry("short", strategy.short, 100)
You might notice that we have not mentioned Apple’s stock price in the code. All we need to do is open an AAPL chart and it will automatically know to execute the trades in Apple.
Lastly, we will plot the price_change variable in the data window. It’s not necessary, but nice to see and we can confirm that the trades are being executed as they should.
plot(price_change)And here are the results of our strategy.
Only four trades as 5% movements are rare. We’d probably need to see a lot more trades than that to determine if it’s a good strategy.
It did seem to have done a good job picking out that low in March!
Full Code:
//@version=5
strategy("Pair Trade: Apple & Google")

google_close = request.security("GOOG", "D", close)
google_open = request.security("GOOG", "D", open)

price_change = google_close / google_open

if price_change < 0.95
    strategy.entry("long", strategy.long, 100)

if price_change > 1.05
    strategy.entry("short", strategy.short, 100)

plot(price_change)
How to modify our scripts without coding?
A cool feature of Pine script is that we can create custom inputs to easily change the parameters of our strategies and indicators.
Take a look at the standard ATR indicator offered in Tradingivew. Note how easy it is to modify the length and even the colors via the Style tab.
We can achieve the same for the studies and strategies created in Pine script by using the input() function.
Here is an example of the input function that will allow the user to customize the percent change from the last strategy example.
longTrigger = input(title="% Change for short entries", defval=5)

shortTrigger = input(title="% Change for long entries", defval=5)
Let’s go through the parameters that are passed through the input() function.
- title – this is where we specify the text that the user sees when trying to change the value of that particular parameter.
- defval – this is the default value.
We can now get values from the user. But they will be inputting a value such as 5(%). We need to convert this to 1.05 for our if statements.
longTrigger := 1 - longTrigger/100
shortTrigger := 1 + shortTrigger/100
And we need to change our if statements to look at our newly created variables based on user input rather than the previously hard-coded values.
if price_change < longTrigger
    strategy.entry("long", strategy.long, 100)

if price_change > shortTrigger
    strategy.entry("short", strategy.short, 100)
To access the input options, click on the gear icon next to the name of your strategy in the data window.
Custom values can now be set for the percentage change used in the strategy.
There is also a Properties window that will allow you to set custom options for other parts of the strategy.
And a Style window to customize plotting options.
Full Code:
//@version=5
strategy("Pair Trade: Inputs")

longTrigger = input(title="% Change for short entries", defval=5)
shortTrigger = input(title="% Change for long entries", defval=5)

longTrigger := 1 - longTrigger/100
shortTrigger := 1 + shortTrigger/100

google_close = request.security("GOOG", "D", close)
google_open = request.security("GOOG", "D", open)

price_change = google_close / google_open

if price_change < longTrigger
    strategy.entry("long", strategy.long, 100)

if price_change > shortTrigger
    strategy.entry("short", strategy.short, 100)

plot(price_change)
How to Plot with Pine script?
So far we’ve used the standard plot() function to plot certain things to the screen. Pine script has several other commands that we can use for our output and we will go through a few of them.
Plotting Forex market hours
Knowing when the markets open and close is something to be mindful of. This can be quite tough to figure out for Forex traders.
Forex trades 24 hours a day and 5 days a week. Different markets around the world open and close during the day which impacts currency volatility.
Let’s program an indicator that will tell us with a quick glance at the chart when the markets are expected to be the busiest.
Most Forex traders are paying attention to the London and New York sessions. We will start by specifying the time for these sessions.
//@version=5
indicator("Forex Sessions", overlay=true)

London = time(timeframe.period, "0700-1500")
NY = time(timeframe.period, "1200-2000")
We’ve used the time() function here to create a period. In the parameters, we are using 0700 UTC for the start time of the London session and 1500 UTC for the end time.
The London variable will now contain the bar time if the bar falls in between that period. Otherwise, it will show a NaN (not a value).
We can use an if statement to see to check the output of the London variable.
val = if (na(London))
    1
else
    0
In the code above, we are using a built-in function called na(). What this does is check whether the variable has a NaN value or not.
if the Londonvariable returns Nan, it means the bar is outside of London trading hours.
In this event, a variable called val will be assigned the integer 1. Otherwise, the valvariable will be set at 0.
Lastly, we plot the newly created valvariable.
plot(val)Here is what our chart looks like after saving and adding this indicator to the chart.
That doesn’t look too good. It is correctly showing when the London market is open, but plotting those values has made our candlesticks illegible.
We could plot it in the data window so that the candles are easier to see, but it still would not be easy to visualize the market open and close.
Also, the code doesn’t look too good.
Let’s start by using a one-line if statement to clean up our code a bit.
na(London) ? 1 : 0This code performs the same function as the if statement before. We don’t need to use the valvariable in this case. Let’s break down the syntax.
na(London)This part is checking to see if the Londonvariable contains a NaN value.
? 1 : 0The question mark here is a short form for an if/else statement.
What follows the question mark is the important part. There are two numbers here separated by a colon. The number before the colon, 1 in this case, is what should be returned in the event the if statement is true.
The number after the colon, 0 in this case, gets returned when the if statement returns false.
We can then take the entire syntax and wrap it in a plot function, saving the effort of storing it to a variable first.
plot(na(London) ? 1 : 0)So now we’ve cleaned up the if statement into a one-line piece of code.
To make the chart easier to read, we can plot a different background color if the London market is open.
To do this, we swap the plot() function with the bgcolor() function. This allows us to change the background color.
bgcolor(na(London) ? 1 : 0)Also, we will specify a color for when the market is open.
bgcolor(na(London) ? na : color.blue)Our chart is starting to look a lot better!
The last thing we will do is add code to see if the New York market is open, and set the background to green if it is.
bgcolor(na(NY) ? na : color.green)You’ll notice that there are three colors on the chart below.
That’s because there is an overlap between the London and New York sessions, this is usually the most volatile time of the day.
Now we can easily see the sessions and quickly pick out things like the high set in European trading or the low that was printed during the overlap.
Full Code:
//@version=5
indicator("Forex Sessions", overlay=true)

Tokyo = time(timeframe.period, "0000-0800")
London = time(timeframe.period, "0700-1500")
NY = time(timeframe.period, "1200-2000")

bgcolor(na(Tokyo) ? na : color.fuchsia)
bgcolor(na(London) ? na : color.blue)
bgcolor(na(NY) ? na : color.green)
Plotting Annotations
There are several options to print annotations. As an example, you can use the hline() function to draw a horizontal level across the chart.
There is a plotchar() function that allows you to plot ASCII characters on your chart. This is often used to plot a note either on top or on the bottom of the price bar.
Another common plotting function is plotshape() which allows you to plot various shapes. This one is quite popular as a lot of people use it to plot arrows on the top or bottom of bars to show buy or sell signals.
For a complete list of the various annotations available, check out the Annotations overview in the Pine script user manual.
How can I create a custom indicator in Pine script?
We are going to create a multi-timeframe indicator.
This is based on a scalping strategy that I used when I first started trading. It is a mean reversion strategy that works well during the early Asian session in the Forex markets when things are generally quiet.
The strategy uses Bollinger Bands on a 5-minute chart and RSI on a 1-minute chart.
The idea is to look for rsi divergence on a 1-minute chart when the price reaches the upper or lower Bollinger band on a 5-minute chart.
A potential target is the midline of the 5-minute Bollinger band or the lower line of a 1-minute Bollinger band.
The above image is an example of the strategy. The Forex sessions indicator that we used in a previous example was used here to show when the Asian session is open.
This strategy works best in the first half of the session, after that the risk of a breakout or directional move tends to increase.
When I traded this strategy, I had to keep two charts open, a 1-minute and a 5-minute chart.
But the example above shows the 5-minute Bollinger bands drawn directly on a 1-minute chart. We will create this indicator in Pine script.
//@version=5
indicator(title="Higher TF BBands", shorttitle="TF BBands", overlay=true)
We start by declaring a name for the script and indicating it is an indicator. A shorter title can be added as well, this is the name that will be shown on the charts.
Next, we set some user inputs. We can duplicate most of the inputs from the regular Bollinger band indicator (as shown in the image above) for our custom indicator.
// Get user input
tf = input(title="BBands Timeframe", defval="5")
len = input(title="Length", defval=20)
stddev = input(title='StdDev', defval=2)
We can create the Bollinger band indicator from a built-in helper function.
[middle, upper, lower] = ta.bb(close, len, stddev)There are three values returned from this function. The lower, mid, and upper band. These are saved individually to variables.
The values should be calculated on a different time frame. We can use the security() function to point to the time frame chosen by the user.
This is stored in the tf variable created by the earlier user input.
hbbandsMid = request.security(syminfo.tickerid, tf, middle, barmerge.gaps_on, barmerge.lookahead_off)
hbbandsUpper = request.security(syminfo.tickerid, tf, upper, barmerge.gaps_on, barmerge.lookahead_off)
hbbandsLower = request.security(syminfo.tickerid, tf, lower, barmerge.gaps_on, barmerge.lookahead_off)
The ticker symbol remains the same, so we’ve used syminfo.tickerid which will return whichever ticker is being displayed on the main chart.
And that does it, all that’s left is to plot the new indicator.
plot(hbbandsMid)
plot(hbbandsUpper)
plot(hbbandsLower)
We can now see Bollinger bands from a 5-minute chart displayed on a 1-minute chart.
The inputs allow for easy customization of Bollinger band parameters and allow this indicator to work with any time frame combination.
Full Code:
//@version=5
indicator(title="Higher TF BBands", shorttitle="TF BBands", overlay=true)

// Get user input
tf = input(title="BBands Timeframe", defval="60")
len = input(title="Length", defval=20)
stddev = input(title='StdDev', defval=2)

[middle, upper, lower] = ta.bb(close, len, stddev)

hbbandsMid = request.security(syminfo.tickerid, tf, middle, barmerge.gaps_on, barmerge.lookahead_off)
hbbandsUpper = request.security(syminfo.tickerid, tf, upper, barmerge.gaps_on, barmerge.lookahead_off)
hbbandsLower = request.security(syminfo.tickerid, tf, lower, barmerge.gaps_on, barmerge.lookahead_off)

plot(hbbandsMid)
plot(hbbandsUpper)
plot(hbbandsLower)
Final Thoughts
If you’ve been following along with the examples, you will have a good idea of what Pine script is capable of doing.
Overall, there is a lot you can do with Pine script, even though it has certain limitations. It’s possible to code up a strategy really quickly once you get the hang of things.
From there, it’s always an option to take that logic and program it into another language if you want to build on it and leverage third-party libraries.
The plotting functions are great, and the ability to make custom indicators is really useful for both manual traders and automated systems.
The comprehensive statistics offered for strategies is also a big plus point for Pine script.
TradingView has several resources if you want to take your Pine script coding skills a step further.
Some help functions have already been discussed in this article. In addition to that, there is also a help option from within Pine editor.
Here are a few other resources –
- Quickstart Guide – This gives an example of an indicator and breaks the script down line by line.
- Pine Script v5 User Manual – A detailed manual for Pine script.
- TradingView Blog – Announcements of new features which often contain sample code
- TradingView Scripts Library – A library of open source Pine script studies and strategies.
The last option on the list is a great resource as often another trader might have already coded the indicator or strategy you are after.
It is also a good resource to draw ideas from to build your own indicators or strategies.
If you’d like to try out some of the examples, a one-click download of all the code is available on GitHub. Simply click the green button and choose download zip. The code will be in text files which can be copied over to Tradingview’s Pine editor.
Без правильных торговых инструментов вы не сможете проводить эффективный технический анализ. Сильная торговая стратегия поможет вам избежать типичных ошибок, улучшить управление рисками и повысить вашу способность выявлять возможности и использовать их в своих интересах.
Для многих TradingView — это платформа для построения графиков. Мощное веб-приложение HTML5, являющееся центром инструментов технического анализа, используется миллионами людей для отслеживания движений на Forex, криптовалютах и традиционных фондовых рынках.
TradingView имеет множество мощных функций: он позволяет нам отслеживать активы на многочисленных торговых платформах и публиковать торговые идеи в своей социальной сети. В этой статье мы остановимся на его настраиваемости. Хорошо, мы будем использовать Pine Script , собственный язык программирования TradingView, который предоставляет нам детальный контроль над макетами наших диаграмм.
Давайте начнем!
Pine Script — это язык сценариев, который можно использовать для изменения ваших графиков TradingView. Платформа уже предоставляет вам множество функций для этого, но Pine Script позволяет сделать еще один шаг вперед. Если вы хотите изменить цвета свечей или протестировать новую стратегию на истории, редактор Pine позволит вам настроить графики в реальном времени по своему усмотрению.
Сам код отлично документирован, поэтому обязательно ознакомьтесь с руководством пользователя для получения дополнительной информации. Наша цель в этом руководстве — обсудить некоторые основы и представить индикаторы, которые могут пригодиться при торговле криптовалютой.
Начать работу с Pine Script невероятно просто. Любой код, который мы пишем, запускается на серверах TradingViews, поэтому мы можем получить доступ к редактору и разработать наши скрипты из браузера без дополнительной загрузки или настройки.
В этом руководстве мы собираемся построить график валютной пары Bitcoin / Binance USD ( BTCBUSD ). Если у вас его еще нет, создайте бесплатную учетную запись (также доступна профессиональная подписка, но это не обязательно для этого руководства).
Перейдите по этой ссылке, и вы увидите диаграмму, похожую на следующую:

Ваш, вероятно, будет более свежим.
Здесь мы хотим получить полнофункциональную диаграмму, нажав кнопку, чтобы получить к ней доступ. Это дает нам гораздо более подробный обзор, инструменты для рисования и опции для построения линий тренда, среди прочего.

Полнофункциональный график. Вы можете настроить временные рамки, нажимая на представления над выделенными вкладками.
Мы не будем обсуждать, как использовать различные доступные инструменты, но если вы серьезно относитесь к техническому анализу, мы настоятельно рекомендуем вам ознакомиться с ними. В левом нижнем углу (обведенном на изображении) вы увидите несколько разных вкладок, нажмите на Pine Editor .

В этом редакторе происходит волшебство. Скажите ему, что мы хотим сделать, затем нажмите « Добавить в диаграмму», чтобы увидеть, как наши аннотации появятся выше. Обратите внимание, что все может стать беспорядочным, если мы включим несколько аннотаций одновременно, поэтому хорошо удаляйте их между примерами ( щелкните правой кнопкой мыши на диаграмме, чтобы удалить индикаторы ).
Как видите, у нас уже есть пара строк кода. Давайте нажмем « Добавить в диаграмму», чтобы увидеть, что произойдет.

Вторая диаграмма добавляется под исходной. Новая диаграмма представляет те же данные. Наведите указатель мыши на Мой сценарий и нажмите крестик, чтобы удалить его. Теперь давайте углубимся в код.
учеба (Мой сценарий)
Эта первая строка просто настраивает нашу аннотацию. Для этого требуется только имя, которое вы хотите назвать индикатором (в данном случае My Script), но есть также некоторые дополнительные параметры, которые мы можем добавить. Одним из них является наложение , которое сообщает TradingView о необходимости разместить индикатор на существующем графике (а не в новом сегменте). Как видно из нашего первого примера, по умолчанию установлено значение false . Хотя сейчас мы не увидим его в действии, overlay = true добавляет индикатор к существующему графику.
сюжет (близко)
Эта линия является инструкцией по построению цены закрытия биткойна. plot просто дает нам линейный график, но мы также можем отображать свечи и бары, а также вскоре увидеть.
Теперь давайте попробуем следующее:
// @ version = 4study (My Script, overlay = true) plot (open, color = color.purple)
После того, как вы добавите это, вы должны увидеть вторую диаграмму (которая выглядит так, как будто оригинал смещен вправо). Вместо этого все, что мы сделали, — это построение цены открытия , и, поскольку текущие дни открытия — это закрытие предыдущих дней, имеет смысл, что они имеют идентичную форму.
Хорошо! Давайте избавимся от текущих аннотаций (помните, мы делаем это, щелкнув правой кнопкой мыши и выбрав « Удалить индикаторы» ). Наведите указатель мыши на биткойн / BUSD и нажмите кнопку « Скрыть» , чтобы очистить и текущий график.
Многие трейдеры предпочитают свечные графики, поскольку они дают нам больше информации, чем простой график, подобный тому, который мы только что сделали. Давайте добавим их дальше.
// @ version = 4study (My Script, overlay = true) plotcandle (open, high, low, close)
Это хорошее начало, но из-за отсутствия цветов он немного приглушен. В идеале у нас должны быть красные свечи, когда цена открытия больше, чем цена закрытия для данного таймфрейма, и зеленые, если цена закрытия превышает открытие. Хорошо добавьте строку над функцией plotcandle () :
// @ version = 4study (My Script, overlay = true) colors = open = close? color.red: color.greenplotcandle (открытие, максимум, минимум, закрытие)
Он просматривает каждую свечу и проверяет, больше ли цена закрытия закрытию. Если это так, это означает, что цены упали за период, поэтому свеча будет окрашена в красный цвет. В противном случае он окрасится в зеленый цвет. Измените функциюplotcandle (), чтобы передать эту цветовую схему в:
// @ version = 4study (My Script, overlay = true) colors = open = close? color.red: color.greenplotcandle (открытие, максимум, минимум, закрытие, цвет = цвета)
Удалите текущие индикаторы, если вы еще этого не сделали, и добавьте этот на график. Теперь у нас должно получиться что-то похожее на обычный свечной график.

Красивый!
У нас есть некоторые основы. Перейдем к нашему первому пользовательскому индикатору — экспоненциальной скользящей средней или EMA. Это ценный инструмент, поскольку он позволяет нам отфильтровать любой рыночный шум и сгладить ценовое движение.
EMA немного отличается от простой скользящей средней (SMA) тем, что придает больший вес самым последним данным. Он, как правило, более реагирует на внезапные движения и часто используется для краткосрочной игры (например, в дневной торговле).
Простая скользящая средняя (SMA)
С таким же успехом мы могли бы построить SMA, чтобы потом сравнить их. Добавьте эту строку в свой скрипт:
сюжет (sma (близко, 10))
Это отображает среднее значение за предыдущие десять дней. Измените число в скобках, чтобы увидеть, как изменяется кривая с учетом разной длины.

SMA, основанная на предыдущих десяти днях.
Экспоненциальная скользящая средняя (EMA)
EMA будет немного сложнее понять, но не беспокойтесь. Давайте сначала разберем формулу:
EMA = (Close - EMA предыдущих дней) * множитель - EMA предыдущих дней
Итак, о чем это нам говорит? Итак, для каждого дня мы рассчитываем новую скользящую среднюю на основе предыдущей. Множитель — это то, что определяет последний период, и рассчитывается по следующей формуле:
Множитель = 2 / (длина EMA + 1)
Как и в случае с простыми скользящими средними, нам нужно указать, какова будет длина EMA. Синтаксически функция построения EMA аналогична функции SMA. Постройте его рядом с SMA, чтобы вы могли сравнить два:
// @ version = 4study (My Script, overlay = true) plot (sma (close, 10)) plot (ema (close, 10))

Вы можете увидеть небольшую разницу в двух типах скользящей средней.
Встроенные скрипты
До сих пор мы писали наш код вручную, чтобы вы могли его почувствовать. Но давайте представим кое-что, что может сэкономить нам время, особенно если мы пишем более сложные скрипты, а мы не хотим делать их с нуля.
В верхней правой части редактора нажмите « Создать» . Вы получите раскрывающееся меню со всеми видами различных технических индикаторов. Нажмите « Экспоненциальная скользящая средняя», чтобы увидеть исходный код индикатора EMA.

Продолжайте и добавьте это в диаграмму.
Этот отличается от нашего, вы заметите функции input () . Они хороши с точки зрения удобства использования, так как вы можете щелкнуть это поле

… и легко изменить некоторые значения во всплывающем окне, щелкнув колесо настроек .

Давайте добавим пару функций input () в наш следующий скрипт, чтобы продемонстрировать это.
Индекс относительной силы (RSI) — еще один важный индикатор в техническом анализе. Он известен как индикатор импульса , что означает, что он измеряет скорость, по которой активы покупаются и продаются. Индекс RSI, представленный по шкале от 0 до 100, пытается проинформировать инвесторов о том, являются ли активы перекупленными или перепроданными. Как правило, актив может считаться перепроданным, если его оценка меньше или равна 30, и он может быть перекуплен с оценкой больше или равной 70.
Если вы перейдете к новой стратегии RSI , вы сможете убедиться в этом сами. RSI обычно измеряется за периоды в 14 часов (т.е. 14 часов или 14 дней), но вы можете изменить этот параметр в соответствии со своей собственной стратегией.
Добавьте это в диаграмму. Теперь вы должны увидеть несколько стрелок (определяемых функцией strategy.entry () в коде). RsiLE указывает на потенциальную возможность длинной позиции по активу, поскольку он может быть перепродан. RsiSE выделяет возможные точки для короткой продажи актива в случае его перекупленности. Обратите внимание, что, как и в случае со всеми индикаторами, вы не должны обязательно полагаться на них как на надежное доказательство того, что цены будут снижаться / расти.
У нас есть способ протестировать наши пользовательские индикаторы. Хотя производительность в прошлом не является гарантией будущих результатов, тестирование наших скриптов на истории может дать нам представление о том, насколько они эффективны при улавливании сигналов.
Вот пример простого скрипта ниже. Мы собираемся создать простую стратегию, которая открывает длинную позицию, когда цена BTC падает ниже 11000 долларов, и закрывает позицию, когда цена превышает 11300 долларов. Затем мы можем увидеть, насколько прибыльной была бы эта стратегия исторически.
// @ version = 4strategy (ToDaMoon, overlay = true) enter = input (11000) exit = input (11300) price = closeif (price = enter) strategy.entry (BuyTheDip, strategy.long, comment = BuyTheDip) if (price = выход) strategy.close_all (comment = SellTheNews)
Здесь мы определили вход и выход, поскольку обе переменные являются входами, а это означает, что мы можем изменить их на графике позже. Мы также настраиваем ценовую переменную, которая принимает значение закрытия для каждого периода. Затем у нас есть логика в виде операторов if . Если часть в скобках истинна, то будет запущен блок с отступом под ней. В противном случае он будет пропущен.
Итак, если цена меньше или равна нашей желаемой точке входа, первое выражение оценивается как истинное, и мы открываем длинную позицию. Как только цена станет равной или превысит желаемый выход, сработает второй блок, закрывающий все открытые позиции.
Хорошо пометите график стрелками, которые показывают, где мы вошли / вышли, поэтому мы указали, как маркировать эти точки с помощью параметра комментария (в этом примере BuyTheDip и SellTheNews). Скопируйте код и добавьте его на диаграмму.

Теперь вы можете видеть индикаторы на графике. Возможно, вам придется уменьшить масштаб.
TradingView автоматически применяет ваши правила к более старым данным. Вы также заметите, что он переключается с Pine Editor на вкладку Strategy Tester . Это позволяет вам видеть обзор вашей потенциальной прибыли, список сделок и эффективность каждой отдельной сделки.

Позиции, которые мы открыли и покинули.
Пришло время написать наш собственный сценарий, используя некоторые из уже знакомых нам концепций. Мы собираемся объединить EMA и RSI и использовать их значения для раскрашивания свечей, чтобы получить информацию, которую мы можем легко визуализировать.
Это не следует истолковывать как финансовый совет, поскольку нет объективно правильного способа использования этого индикатора. Как и все остальные, его следует использовать с другими инструментами для разработки собственной стратегии.
Теперь поработаем над нашим новым скриптом. Удалите все индикаторы с графика и также скройте график Bitcoin / BUSD, чтобы у нас был чистый холст для работы.
Начнем с определения нашего исследования. Не стесняйтесь называть его как хотите, только не забудьте установить overlay = true .
исследование (title = Binance Academy Script, overlay = true)
Вспомните нашу формулу EMA ранее. Нам нужно предоставить множитель с длиной EMA. Давайте сделаем его вводом, который требует целого числа (то есть без десятичных знаков). Ну и установить , как минимум , что это может быть ( MINVAL ), а значение по умолчанию ( DEFVAL ).
Study (title = Binance Academy Script, overlay = true) emaLength = input (title = EMA Length, type = input.integer, defval = 25, minval = 0)
Используя эту новую переменную, мы можем вычислить значение EMA для каждой свечи на нашем графике:
Study (title = Binance Academy Script, overlay = true) emaLength = input (title = EMA Length, type = input.integer, defval = 25, minval = 0) emaVal = ema (close, emaLength)
Большой. На RSI. Ну дайте ему длину аналогичным образом:
study (title = Binance Academy Script, overlay = true) emaLength = input (title = EMA Length, type = input.integer, defval = 25, minval = 0) emaVal = ema (close, emaLength) rsiLength = input (title = RSI Длина, тип = input.integer, defval = 25, minval = 0)
И теперь мы можем его вычислить:
study (title = Binance Academy Script, overlay = true) emaLength = input (title = EMA Length, type = input.integer, defval = 25, minval = 0) emaVal = ema (close, emaLength) rsiLength = input (title = RSI Длина, тип = input.integer, defval = 25, minval = 0) rsiVal = rsi (close, rsiLength)
На этом этапе давайте соберем логику, которая раскрашивает свечи в зависимости от значений EMA и RSI. Давайте возьмем ситуацию, когда (а) цена закрытия свечи превышает EMA и (б) когда RSI выше 50.
Почему? Что ж, вы можете решить, что эти индикаторы могут использоваться вместе, чтобы сообщать вам, когда открывать или продавать биткойны. Например, вы можете подумать, что выполнение обоих этих условий означает, что сейчас хорошее время для входа в длинную позицию. Или, наоборот, вы можете использовать его, чтобы сообщить вам, когда не открывать короткую позицию, даже если другие индикаторы говорят об обратном.
Итак, наша следующая строка будет выглядеть так:
study (title = Binance Academy Script, overlay = true) emaLength = input (title = EMA Length, type = input.integer, defval = 25, minval = 0) emaVal = ema (close, emaLength) rsiLength = input (title = RSI Длина, тип = input.integer, defval = 25, minval = 0) rsiVal = rsi (close, rsiLength) colors = close emaVal и rsiVal 50? color.green: цвет.красный
Если мы переведем это на простой английский, мы просто скажем, что если значение EMA превышает цену закрытия, а оценка RSI превышает 50, хорошо закрасьте свечу в зеленый цвет. В противном случае хорошо покрасьте его в красный цвет.
Затем постройте EMA:
study (title = Binance Academy Script, overlay = true) emaLength = input (title = EMA Length, type = input.integer, defval = 25, minval = 0) emaVal = ema (close, emaLength) rsiLength = input (title = RSI Длина, тип = input.integer, defval = 25, minval = 0) rsiVal = rsi (close, rsiLength) colors = close emaVal и rsiVal 50? color.green: color.redplot (emaVal, EMA)
Наконец, нарисуйте свечи, обязательно включив параметр цвета :
study (title = Binance Academy Script, overlay = true) emaLength = input (title = EMA Length, type = input.integer, defval = 25, minval = 0) emaVal = ema (close, emaLength) rsiLength = input (title = RSI Длина, тип = input.integer, defval = 25, minval = 0) rsiVal = rsi (close, rsiLength) colors = close emaVal и rsiVal 50? color.green: color.redplot (emaVal, EMA) plotcandle (open, high, low, close, color = colors)
Вот и сценарий! Добавьте его на диаграмму, чтобы увидеть в действии.

График BTC / BUSD с индикатором EMA / RSI.
В этой статье мы рассмотрели несколько основных примеров того, что вы можете делать с помощью TradingViews Pine Editor. К настоящему времени вы должны быть уверены в том, что делаете простые аннотации к графикам цен, чтобы получать дополнительную информацию от ваших собственных индикаторов.
Мы интересовались здесь лишь парой индикаторов, но более сложные из них легко раскрутить, выбрав встроенные скрипты из New или написав их самостоятельно.
Не хватает вдохновения? Следующие статьи могут дать вам некоторые идеи для вашего следующего проекта:
- Краткое руководство по индикатору Parabolic SAR
- Руководство по освоению коррекции Фибоначчи
- Объяснение опережающих и запаздывающих индикаторов
- Пояснения к индикатору MACD