Правильно слово пишется: блок-схе́ма
Сложное слово, состоящее из 2 частей.
блок Ударение падает на слог с единственной гласной буквой в слове.Всего в слове 4 буквы, 1 гласная, 3 согласных, 1 слог.
Гласные: о;
Согласные: б, л, к. схема Ударение падает на 1-й слог с буквой е.
Всего в слове 5 букв, 2 гласных, 3 согласных, 2 слога.
Гласные: е, а;
Согласные: с, х, м.
Номера букв в слове
Номера букв в слове «блок-схема» в прямом и обратном порядке:
- 9
б
1 - 8
л
2 - 7
о
3 - 6
к
4 - —
- 5
с
5 - 4
х
6 - 3
е
7 - 2
м
8 - 1
а
9
Слово «блок-схема» состоит из 9-ти букв и 1-го дефиса.
Разбор по составу
Разбор по составу (морфемный разбор) слова блок-схема делается следующим образом:
блок — схем а
Морфемы слова: блок, схем — корни, а — окончание, блок-схем — основы.
Рады помочь вам узнать, как пишется слово «блок-схема».
Пишите и говорите правильно.
О словаре
Сайт создан на основе «Русского орфографического словаря», составленного Институтом русского языка имени В. В. Виноградова РАН. Объем второго издания, исправленного и дополненного, составляет около 180 тысяч слов, и существенно превосходит все предшествующие орфографические словари. Он является нормативным справочником, отражающим с возможной полнотой лексику русского языка начала 21 века и регламентирующим ее правописание.
Схе́ма — графическое представление определения, анализа или метода решения задачи, в котором используются символы для отображения данных, потока, оборудования и т. д.
Все значения слова «блок-схема»
-
Вы можете время от времени ощущать себя во власти блок-схем и диаграмм, но это лучше, чем код, хранящийся в корпоративной базе данных без какого-либо указания на то, как он работает и какую проблему он призван решать.
-
Другой вариант – заставить проблемного сотрудника зазубрить подготовленные вами фразы, а потом забрать у него шпаргалки и дать поработать, используя только блок-схему разговора.
-
В общем виде мониторинг окружающей среды можно представить в виде блок-схемы (рис. 1.2).
- (все предложения)
- подмножество
- индексирование
- кодировка
- компоновка
- дублирование
- (ещё синонимы…)
- Разбор по составу слова «блок-схема»
Ответ:
Правильное написание слова — блок-схема
Ударение и произношение — блок-сх`ема
Выберите, на какой слог падает ударение в слове — ВТРИДОРОГА?
или
Слово состоит из букв:
Б,
Л,
О,
К,
-,
С,
Х,
Е,
М,
А,
Похожие слова:
блок
блок-аппарат
блок-диаграмма
блок-сигнал
блок-тормоз
блокада
блокадный
блокаж
блоках
Рифма к слову блок-схема
система, приема, оказываема, сознаваема, отбиваема, рассматриваема, ерема, подъема, мадиама, непоколебима, панорама, немыслима, патриотизма, программа, дама, эконома, руководима, сама, мама, рама, необходима, механизма, цнайма, зима, неудержима, дома, мистицизма, непостижима, займа, деспотизма, рима, шрама, адама, любима, педантизма, организма, герасима, знакома, дилемма, ведома, эгоизма, иерусалима, сумма, срама, неопровержима, ваграма, храма, параллелограмма, потсдама, рома
Толкование слова. Правильное произношение слова. Значение слова.
блок-схема
- блок-схема
-
блок-схема, блок-схемы
Слитно или раздельно? Орфографический словарь-справочник. — М.: Русский язык.
.
1998.
Синонимы:
Смотреть что такое «блок-схема» в других словарях:
-
Блок-схема — Схема, определяющая взаимосвязь блоков Источник: ВСН 514 89: Требования к проектированию объектов по производству минеральн … Словарь-справочник терминов нормативно-технической документации
-
блок-схема — — [http://www.iks media.ru/glossary/index.html?glossid=2400324] блок схема [Лугинский Я. Н. и др. Англо русский словарь по электротехнике и электроэнергетике. 2 е издание М.: РУССО, 1995 616 с.] блок схема Условное изображение алгоритма,… … Справочник технического переводчика
-
Блок-схема — в программировании графическое представление программы или алгоритма с использованием стандартных графических элементов (прямоугольников, ромбиков, трапеций и др.), обозначающих команды, действия, данные и т.п. По английски: Flowchart См. также:… … Финансовый словарь
-
блок-схема — сущ., кол во синонимов: 1 • схема (28) Словарь синонимов ASIS. В.Н. Тришин. 2013 … Словарь синонимов
-
БЛОК-СХЕМА — (flowchart) Диаграмма, представляющая собой последовательность логических шагов, необходимых для решения проблемы. Полезный инструмент для программиста, который использует его при планировании программы. В блок схеме имеется ряд условных… … Словарь бизнес-терминов
-
БЛОК-СХЕМА — Блок здесь относится к последовательности событий. Блок схема – графическое или пиктографическое представление такой, последовательности. Первоначально использовавшийся в программировании, этот термин был заимствован психологией наряду с общей… … Толковый словарь по психологии
-
блок-схема — block scheme, flow chart, block diagram *Blockschema схема машини, приладу, апарата, пристрою, в якій основні вузли (блоки), що утворюють її, зображено прямокутниками та іншими фігурами, а зв язок між ними показано лініями зі стрілками … Гірничий енциклопедичний словник
-
Блок-схема — [block diagram, flowchart] – условное изображение алгоритма, программы для ЭВМ, процесса принятия решения, документооборота и т.п., предназначенное для выявления их структуры и общей последовательности операций. Пример Б. с. см. в статье Алгоритм … Экономико-математический словарь
-
Блок-схема — У этого термина существуют и другие значения, см. Блок. Пример блок схемы алгоритма вычисления факториала числа N Схема графическое представление определения, анализа или метода решения задачи, в котором используются символ … Википедия
-
блок-схема — sandaros schema statusas T sritis Standartizacija ir metrologija apibrėžtis Schema, nustatanti pagrindines funkcines gaminio dalis, jų paskirtį ir sąsajas. atitikmenys: angl. block diagram; block scheme vok. Übersichtsschaltplan, m;… … Penkiakalbis aiškinamasis metrologijos terminų žodynas
![]()
Слова русского языка,
поиск и разбор слов онлайн
блок-схема
Правильно слово пишется: блок-схе́ма
Сложное слово, состоящее из 2 частей.
- блок
- Ударение падает на слог с единственной гласной буквой в слове.
Всего в слове 4 буквы, 1 гласная, 3 согласных, 1 слог.
Гласные: о;
Согласные: б, л, к. - схема
- Ударение падает на 1-й слог с буквой е.
Всего в слове 5 букв, 2 гласных, 3 согласных, 2 слога.
Гласные: е, а;
Согласные: с, х, м.
Номера букв в слове
Номера букв в слове «блок-схема» в прямом и обратном порядке:
- 9
б
1 - 8
л
2 - 7
о
3 - 6
к
4 -
—
- 5
с
5 - 4
х
6 - 3
е
7 - 2
м
8 - 1
а
9
Слово «блок-схема» состоит из 9-ти букв и 1-го дефиса.
Разбор по составу
Разбор по составу (морфемный разбор) слова блок-схема делается следующим образом:
блок—схема
Морфемы слова: блок, схем — корни, а — окончание, блок-схем — основы.
![]()
From Wikipedia, the free encyclopedia

A simple flowchart representing a process for dealing with a non-functioning lamp.
A flowchart is a type of diagram that represents a workflow or process. A flowchart can also be defined as a diagrammatic representation of an algorithm, a step-by-step approach to solving a task.
The flowchart shows the steps as boxes of various kinds, and their order by connecting the boxes with arrows. This diagrammatic representation illustrates a solution model to a given problem. Flowcharts are used in analyzing, designing, documenting or managing a process or program in various fields.[1]
Overview[edit]
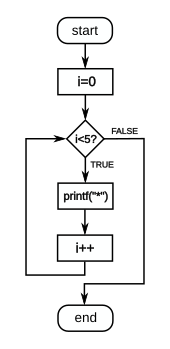
Flow diagram a C-style for loop, representing the following code:
for(i=0;i<5;i++)
  printf("*");
The loop will cause five asterisks to be printed.
Flowcharts are used to design and document simple processes or programs. Like other types of diagrams, they help visualize the process. Two of the many benefits are flaws and bottlenecks may become apparent. Flowcharts typically use the following main symbols:
- A process step, usually called an activity, is denoted as a rectangular box.
- A decision is usually denoted as a diamond.
A flowchart is described as «cross-functional» when the chart is divided into different vertical or horizontal parts, to describe the control of different organizational units. A symbol appearing in a particular part is within the control of that organizational unit. A cross-functional flowchart allows the author to correctly locate the responsibility for performing an action or making a decision, and to show the responsibility of each organizational unit for different parts of a single process.
Flowcharts represent certain aspects of processes and are usually complemented by other types of diagram. For instance, Kaoru Ishikawa defined the flowchart as one of the seven basic tools of quality control, next to the histogram, Pareto chart, check sheet, control chart, cause-and-effect diagram, and the scatter diagram. Similarly, in UML, a standard concept-modeling notation used in software development, the activity diagram, which is a type of flowchart, is just one of many different diagram types.
Nassi-Shneiderman diagrams and Drakon-charts are an alternative notation for process flow.
Common alternative names include: flow chart, process flowchart, functional flowchart, process map, process chart, functional process chart, business process model, process model, process flow diagram, work flow diagram, business flow diagram. The terms «flowchart» and «flow chart» are used interchangeably.
The underlying graph structure of a flowchart is a flow graph, which abstracts away node types, their contents and other ancillary information.
History[edit]
The first structured method for documenting process flow, the «flow process chart», was introduced by Frank and Lillian Gilbreth in the presentation «Process Charts: First Steps in Finding the One Best Way to do Work», to members of the American Society of Mechanical Engineers (ASME) in 1921.[2] The Gilbreths’ tools quickly found their way into industrial engineering curricula. In the early 1930s, an industrial engineer, Allan H. Mogensen began to train business people in the use of some of the tools of industrial engineering at his Work Simplification Conferences in Lake Placid, New York.
Art Spinanger, a 1944 graduate of Mogensen’s class, took the tools back to Procter and Gamble where he developed their Deliberate Methods Change Program. Ben S. Graham, another 1944 graduate, Director of Formcraft Engineering at Standard Register Industrial, applied the flow process chart to information processing with his development of the multi-flow process chart, to present multiple documents and their relationships.[3] In 1947, ASME adopted a symbol set derived from Gilbreth’s original work as the «ASME Standard: Operation and Flow Process Charts.»[4]
Douglas Hartree in 1949 explained that Herman Goldstine and John von Neumann had developed a flowchart (originally, diagram) to plan computer programs.[5] His contemporary account was endorsed by IBM engineers[6] and by Goldstine’s personal recollections.[7] The original programming flowcharts of Goldstine and von Neumann can be found in their unpublished report, «Planning and coding of problems for an electronic computing instrument, Part II, Volume 1» (1947), which is reproduced in von Neumann’s collected works.[8]
The flowchart became a popular tool for describing computer algorithms, but its popularity decreased in the 1970s, when interactive computer terminals and third-generation programming languages became common tools for computer programming, since algorithms can be expressed more concisely as source code in such languages. Often pseudo-code is used, which uses the common idioms of such languages without strictly adhering to the details of a particular one.
In the early 21st century, flowcharts were still used for describing computer algorithms.[9] Modern techniques such as UML activity diagrams and Drakon-charts can be considered to be extensions of the flowchart.
Types[edit]
Sterneckert (2003) suggested that flowcharts can be modeled from the perspective of different user groups (such as managers, system analysts and clerks), and that there are four general types:[10]
- Document flowcharts, showing controls over a document-flow through a system
- Data flowcharts, showing controls over a data-flow in a system
- System flowcharts, showing controls at a physical or resource level
- Program flowchart, showing the controls in a program within a system
Notice that every type of flowchart focuses on some kind of control, rather than on the particular flow itself.[10]
However, there are some different classifications. For example, Andrew Veronis (1978) named three basic types of flowcharts: the system flowchart, the general flowchart, and the detailed flowchart.[11] That same year Marilyn Bohl (1978) stated «in practice, two kinds of flowcharts are used in solution planning: system flowcharts and program flowcharts…».[12] More recently, Mark A. Fryman (2001) identified more differences: «Decision flowcharts, logic flowcharts, systems flowcharts, product flowcharts, and process flowcharts are just a few of the different types of flowcharts that are used in business and government».[13]
In addition, many diagram techniques are similar to flowcharts but carry a different name, such as UML activity diagrams.
Building blocks[edit]
Common symbols[edit]
The American National Standards Institute (ANSI) set standards for flowcharts and their symbols in the 1960s.[14] The International Organization for Standardization (ISO) adopted the ANSI symbols in 1970.[15] The current standard, ISO 5807, was revised in 1985.[16] Generally, flowcharts flow from top to bottom and left to right.[17]
| ANSI/ISO Shape | Name | Description |
|---|---|---|
| Flowline (Arrowhead)[15] | Shows the process’s order of operation. A line coming from one symbol and pointing at another.[14] Arrowheads are added if the flow is not the standard top-to-bottom, left-to right.[15] | |

|
Terminal[14] | Indicates the beginning and ending of a program or sub-process. Represented as a stadium,[14] oval or rounded (fillet) rectangle. They usually contain the word «Start» or «End», or another phrase signaling the start or end of a process, such as «submit inquiry» or «receive product». |

|
Process[15] | Represents a set of operations that changes value, form, or location of data. Represented as a rectangle.[15] |

|
Decision[15] | Shows a conditional operation that determines which one of the two paths the program will take.[14] The operation is commonly a yes/no question or true/false test. Represented as a diamond (rhombus).[15] |

|
Input/Output[15] | Indicates the process of inputting and outputting data,[15] as in entering data or displaying results. Represented as a rhomboid.[14] |

|
Annotation[14] (Comment)[15] | Indicating additional information about a step in the program. Represented as an open rectangle with a dashed or solid line connecting it to the corresponding symbol in the flowchart.[15] |

|
Predefined Process[14] | Shows named process which is defined elsewhere. Represented as a rectangle with double-struck vertical edges.[14] |

|
On-page Connector[14] | Pairs of labeled connectors replace long or confusing lines on a flowchart page. Represented by a small circle with a letter inside.[14][18] |
| Off-page Connector[14] | A labeled connector for use when the target is on another page. Represented as a home plate-shaped pentagon.[14][18] |
Other symbols[edit]
The ANSI/ISO standards include symbols beyond the basic shapes. Some are:[17][18]
| Shape | Name | Description |
|---|---|---|

|
Data File or Database | Data represented by a cylinder symbolizing a disk drive. |
| Document | Single documents represented as a rectangle with a wavy base. | |
| Multiple documents represented as a stack of rectangles with wavy bases. | ||
| Manual operation | Represented by a trapezoid with the longest parallel side at the top, to represent an operation or adjustment to process that can only be made manually. | |
| Manual input | Represented by quadrilateral, with the top irregularly sloping up from left to right, like the side view of a keyboard. | |
| Preparation or Initialization | Represented by an elongated hexagon, originally used for steps like setting a switch or initializing a routine. |
Parallel processing[edit]
- Parallel Mode is represented by two horizontal lines at the beginning or ending of simultaneous operations[17]
For parallel and concurrent processing the Parallel Mode horizontal lines[19] or a horizontal bar[20] indicate the start or end of a section of processes that can be done independently:
- At a fork, the process creates one or more additional processes, indicated by a bar with one incoming path and two or more outgoing paths.
- At a join, two or more processes continue as a single process, indicated by a bar with several incoming paths and one outgoing path. All processes must complete before the single process continues.[20]
Software[edit]
Diagramming[edit]
Any drawing program can be used to create flowchart diagrams, but these will have no underlying data model to share data with databases or other programs such as project management systems or spreadsheet. Many software packages exist that can create flowcharts automatically, either directly from a programming language source code, or from a flowchart description language.
There are several applications and visual programming languages[21] that use flowcharts to represent and execute programs. Generally these are used as teaching tools for beginner students.
See also[edit]
[edit]
|
[edit]
|
References[edit]
- ^ SEVOCAB: Software Systems Engineering Vocabulary. Term: Flow chart. Retrieved 31 July 2008.
- ^ Frank Bunker Gilbreth, Lillian Moller Gilbreth (1921) «Process Charts» (PDF). Archived from the original on 2015-05-09. Retrieved 2016-05-06.
{{cite web}}: CS1 maint: bot: original URL status unknown (link). American Society of Mechanical Engineers. - ^ Graham, Ben S. Jr. (10 June 1996). «People come first». Keynote Address at Workflow Canada.
- ^ American Society of Mechanical Engineers (1947) ASME standard; operation and flow process charts. New York, 1947. (online version)
- ^ Hartree, Douglas (1949). Calculating Instruments and Machines. The University of Illinois Press. p. 112.
- ^ Bashe, Charles (1986). IBM’s Early Computers. The MIT Press. p. 327. ISBN 9780262022255.
- ^ Goldstine, Herman (1972). The Computer from Pascal to Von Neumann. Princeton University Press. pp. 266–267. ISBN 0-691-08104-2.
- ^ Taub, Abraham (1963). John von Neumann Collected Works. Vol. 5. Macmillan. pp. 80–151.
- ^ Bohl, Rynn: «Tools for Structured and Object-Oriented Design», Prentice Hall, 2007.
- ^ a b Alan B. Sterneckert (2003) Critical Incident Management. p. 126
- ^ Andrew Veronis (1978) Microprocessors: Design and Applications. p. 111
- ^ Marilyn Bohl (1978) A Guide for Programmers. p. 65.
- ^ Mark A. Fryman (2001) Quality and Process Improvement. p. 169.
- ^ a b c d e f g h i j k l m Gary B. Shelly; Misty E. Vermaat (2011). Discovering Computers, Complete: Your Interactive Guide to the Digital World. Cengage Learning. pp. 691–693. ISBN 978-1-111-53032-7.
- ^ a b c d e f g h i j k Harley R. Myler (1998). «2.3 Flowcharts». Fundamentals of Engineering Programming with C and Fortran. Cambridge University Press. pp. 32–36. ISBN 978-0-521-62950-8.
- ^ «ISO 5807:1985». International Organization for Standardization. February 1985. Retrieved 23 July 2017.
- ^ a b c Flowcharting Techniques GC20-8152-1. IBM. March 1970. p. 10.
- ^ a b c «What do the different flowchart shapes mean?». RFF Electronics. Retrieved 23 July 2017.
- ^ Jonathan W. Valvano (2011). Embedded Microcomputer Systems: Real Time Interfacing. Cengage Learning. pp. 131–132. ISBN 978-1-111-42625-5.
- ^ a b Robbie T. Nakatsu (2009). Reasoning with Diagrams: Decision-Making and Problem-Solving with Diagrams. John Wiley & Sons. pp. 68–69. ISBN 978-0-470-40072-2.
- ^ Myers, Brad A. «Visual programming, programming by example, and program visualization: a taxonomy.» ACM SIGCHI Bulletin. Vol. 17. No. 4. ACM, 1986.
Further reading[edit]
- ISO 5807 (1985). Information processing – Documentation symbols and conventions for data, program and system flowcharts, program network charts and system resources charts. International Organization for Standardization.
- ISO 10628: Diagrams for the chemical and petrochemical industry
- ECMA 4: Flowcharts (withdrawn – list of withdrawn standards)
- Schultheiss, Louis A., and Edward M. Heiliger. «Techniques of flow-charting.» (1963); with introduction by Edward Heiliger.
External links[edit]
![]()
Wikimedia Commons has media related to Flow chart.
- Flowcharting Techniques: An IBM manual from 1969 (5 MB; PDF)
![]()
From Wikipedia, the free encyclopedia
A simple flowchart representing a process for dealing with a non-functioning lamp.
A flowchart is a type of diagram that represents a workflow or process. A flowchart can also be defined as a diagrammatic representation of an algorithm, a step-by-step approach to solving a task.
The flowchart shows the steps as boxes of various kinds, and their order by connecting the boxes with arrows. This diagrammatic representation illustrates a solution model to a given problem. Flowcharts are used in analyzing, designing, documenting or managing a process or program in various fields.[1]
Overview[edit]
Flow diagram a C-style for loop, representing the following code:
for(i=0;i<5;i++)
  printf("*");
The loop will cause five asterisks to be printed.
Flowcharts are used to design and document simple processes or programs. Like other types of diagrams, they help visualize the process. Two of the many benefits are flaws and bottlenecks may become apparent. Flowcharts typically use the following main symbols:
- A process step, usually called an activity, is denoted as a rectangular box.
- A decision is usually denoted as a diamond.
A flowchart is described as «cross-functional» when the chart is divided into different vertical or horizontal parts, to describe the control of different organizational units. A symbol appearing in a particular part is within the control of that organizational unit. A cross-functional flowchart allows the author to correctly locate the responsibility for performing an action or making a decision, and to show the responsibility of each organizational unit for different parts of a single process.
Flowcharts represent certain aspects of processes and are usually complemented by other types of diagram. For instance, Kaoru Ishikawa defined the flowchart as one of the seven basic tools of quality control, next to the histogram, Pareto chart, check sheet, control chart, cause-and-effect diagram, and the scatter diagram. Similarly, in UML, a standard concept-modeling notation used in software development, the activity diagram, which is a type of flowchart, is just one of many different diagram types.
Nassi-Shneiderman diagrams and Drakon-charts are an alternative notation for process flow.
Common alternative names include: flow chart, process flowchart, functional flowchart, process map, process chart, functional process chart, business process model, process model, process flow diagram, work flow diagram, business flow diagram. The terms «flowchart» and «flow chart» are used interchangeably.
The underlying graph structure of a flowchart is a flow graph, which abstracts away node types, their contents and other ancillary information.
History[edit]
The first structured method for documenting process flow, the «flow process chart», was introduced by Frank and Lillian Gilbreth in the presentation «Process Charts: First Steps in Finding the One Best Way to do Work», to members of the American Society of Mechanical Engineers (ASME) in 1921.[2] The Gilbreths’ tools quickly found their way into industrial engineering curricula. In the early 1930s, an industrial engineer, Allan H. Mogensen began to train business people in the use of some of the tools of industrial engineering at his Work Simplification Conferences in Lake Placid, New York.
Art Spinanger, a 1944 graduate of Mogensen’s class, took the tools back to Procter and Gamble where he developed their Deliberate Methods Change Program. Ben S. Graham, another 1944 graduate, Director of Formcraft Engineering at Standard Register Industrial, applied the flow process chart to information processing with his development of the multi-flow process chart, to present multiple documents and their relationships.[3] In 1947, ASME adopted a symbol set derived from Gilbreth’s original work as the «ASME Standard: Operation and Flow Process Charts.»[4]
Douglas Hartree in 1949 explained that Herman Goldstine and John von Neumann had developed a flowchart (originally, diagram) to plan computer programs.[5] His contemporary account was endorsed by IBM engineers[6] and by Goldstine’s personal recollections.[7] The original programming flowcharts of Goldstine and von Neumann can be found in their unpublished report, «Planning and coding of problems for an electronic computing instrument, Part II, Volume 1» (1947), which is reproduced in von Neumann’s collected works.[8]
The flowchart became a popular tool for describing computer algorithms, but its popularity decreased in the 1970s, when interactive computer terminals and third-generation programming languages became common tools for computer programming, since algorithms can be expressed more concisely as source code in such languages. Often pseudo-code is used, which uses the common idioms of such languages without strictly adhering to the details of a particular one.
In the early 21st century, flowcharts were still used for describing computer algorithms.[9] Modern techniques such as UML activity diagrams and Drakon-charts can be considered to be extensions of the flowchart.
Types[edit]
Sterneckert (2003) suggested that flowcharts can be modeled from the perspective of different user groups (such as managers, system analysts and clerks), and that there are four general types:[10]
- Document flowcharts, showing controls over a document-flow through a system
- Data flowcharts, showing controls over a data-flow in a system
- System flowcharts, showing controls at a physical or resource level
- Program flowchart, showing the controls in a program within a system
Notice that every type of flowchart focuses on some kind of control, rather than on the particular flow itself.[10]
However, there are some different classifications. For example, Andrew Veronis (1978) named three basic types of flowcharts: the system flowchart, the general flowchart, and the detailed flowchart.[11] That same year Marilyn Bohl (1978) stated «in practice, two kinds of flowcharts are used in solution planning: system flowcharts and program flowcharts…».[12] More recently, Mark A. Fryman (2001) identified more differences: «Decision flowcharts, logic flowcharts, systems flowcharts, product flowcharts, and process flowcharts are just a few of the different types of flowcharts that are used in business and government».[13]
In addition, many diagram techniques are similar to flowcharts but carry a different name, such as UML activity diagrams.
Building blocks[edit]
Common symbols[edit]
The American National Standards Institute (ANSI) set standards for flowcharts and their symbols in the 1960s.[14] The International Organization for Standardization (ISO) adopted the ANSI symbols in 1970.[15] The current standard, ISO 5807, was revised in 1985.[16] Generally, flowcharts flow from top to bottom and left to right.[17]
| ANSI/ISO Shape | Name | Description |
|---|---|---|
| Flowline (Arrowhead)[15] | Shows the process’s order of operation. A line coming from one symbol and pointing at another.[14] Arrowheads are added if the flow is not the standard top-to-bottom, left-to right.[15] | |
|
|
Terminal[14] | Indicates the beginning and ending of a program or sub-process. Represented as a stadium,[14] oval or rounded (fillet) rectangle. They usually contain the word «Start» or «End», or another phrase signaling the start or end of a process, such as «submit inquiry» or «receive product». |
|
|
Process[15] | Represents a set of operations that changes value, form, or location of data. Represented as a rectangle.[15] |
|
|
Decision[15] | Shows a conditional operation that determines which one of the two paths the program will take.[14] The operation is commonly a yes/no question or true/false test. Represented as a diamond (rhombus).[15] |
|
|
Input/Output[15] | Indicates the process of inputting and outputting data,[15] as in entering data or displaying results. Represented as a rhomboid.[14] |
|
|
Annotation[14] (Comment)[15] | Indicating additional information about a step in the program. Represented as an open rectangle with a dashed or solid line connecting it to the corresponding symbol in the flowchart.[15] |
|
|
Predefined Process[14] | Shows named process which is defined elsewhere. Represented as a rectangle with double-struck vertical edges.[14] |
|
|
On-page Connector[14] | Pairs of labeled connectors replace long or confusing lines on a flowchart page. Represented by a small circle with a letter inside.[14][18] |
| Off-page Connector[14] | A labeled connector for use when the target is on another page. Represented as a home plate-shaped pentagon.[14][18] |
Other symbols[edit]
The ANSI/ISO standards include symbols beyond the basic shapes. Some are:[17][18]
| Shape | Name | Description |
|---|---|---|
|
|
Data File or Database | Data represented by a cylinder symbolizing a disk drive. |
| Document | Single documents represented as a rectangle with a wavy base. | |
| Multiple documents represented as a stack of rectangles with wavy bases. | ||
| Manual operation | Represented by a trapezoid with the longest parallel side at the top, to represent an operation or adjustment to process that can only be made manually. | |
| Manual input | Represented by quadrilateral, with the top irregularly sloping up from left to right, like the side view of a keyboard. | |
| Preparation or Initialization | Represented by an elongated hexagon, originally used for steps like setting a switch or initializing a routine. |
Parallel processing[edit]
- Parallel Mode is represented by two horizontal lines at the beginning or ending of simultaneous operations[17]
For parallel and concurrent processing the Parallel Mode horizontal lines[19] or a horizontal bar[20] indicate the start or end of a section of processes that can be done independently:
- At a fork, the process creates one or more additional processes, indicated by a bar with one incoming path and two or more outgoing paths.
- At a join, two or more processes continue as a single process, indicated by a bar with several incoming paths and one outgoing path. All processes must complete before the single process continues.[20]
Software[edit]
Diagramming[edit]
Any drawing program can be used to create flowchart diagrams, but these will have no underlying data model to share data with databases or other programs such as project management systems or spreadsheet. Many software packages exist that can create flowcharts automatically, either directly from a programming language source code, or from a flowchart description language.
There are several applications and visual programming languages[21] that use flowcharts to represent and execute programs. Generally these are used as teaching tools for beginner students.
See also[edit]
[edit]
|
[edit]
|
References[edit]
- ^ SEVOCAB: Software Systems Engineering Vocabulary. Term: Flow chart. Retrieved 31 July 2008.
- ^ Frank Bunker Gilbreth, Lillian Moller Gilbreth (1921) «Process Charts» (PDF). Archived from the original on 2015-05-09. Retrieved 2016-05-06.
{{cite web}}: CS1 maint: bot: original URL status unknown (link). American Society of Mechanical Engineers. - ^ Graham, Ben S. Jr. (10 June 1996). «People come first». Keynote Address at Workflow Canada.
- ^ American Society of Mechanical Engineers (1947) ASME standard; operation and flow process charts. New York, 1947. (online version)
- ^ Hartree, Douglas (1949). Calculating Instruments and Machines. The University of Illinois Press. p. 112.
- ^ Bashe, Charles (1986). IBM’s Early Computers. The MIT Press. p. 327. ISBN 9780262022255.
- ^ Goldstine, Herman (1972). The Computer from Pascal to Von Neumann. Princeton University Press. pp. 266–267. ISBN 0-691-08104-2.
- ^ Taub, Abraham (1963). John von Neumann Collected Works. Vol. 5. Macmillan. pp. 80–151.
- ^ Bohl, Rynn: «Tools for Structured and Object-Oriented Design», Prentice Hall, 2007.
- ^ a b Alan B. Sterneckert (2003) Critical Incident Management. p. 126
- ^ Andrew Veronis (1978) Microprocessors: Design and Applications. p. 111
- ^ Marilyn Bohl (1978) A Guide for Programmers. p. 65.
- ^ Mark A. Fryman (2001) Quality and Process Improvement. p. 169.
- ^ a b c d e f g h i j k l m Gary B. Shelly; Misty E. Vermaat (2011). Discovering Computers, Complete: Your Interactive Guide to the Digital World. Cengage Learning. pp. 691–693. ISBN 978-1-111-53032-7.
- ^ a b c d e f g h i j k Harley R. Myler (1998). «2.3 Flowcharts». Fundamentals of Engineering Programming with C and Fortran. Cambridge University Press. pp. 32–36. ISBN 978-0-521-62950-8.
- ^ «ISO 5807:1985». International Organization for Standardization. February 1985. Retrieved 23 July 2017.
- ^ a b c Flowcharting Techniques GC20-8152-1. IBM. March 1970. p. 10.
- ^ a b c «What do the different flowchart shapes mean?». RFF Electronics. Retrieved 23 July 2017.
- ^ Jonathan W. Valvano (2011). Embedded Microcomputer Systems: Real Time Interfacing. Cengage Learning. pp. 131–132. ISBN 978-1-111-42625-5.
- ^ a b Robbie T. Nakatsu (2009). Reasoning with Diagrams: Decision-Making and Problem-Solving with Diagrams. John Wiley & Sons. pp. 68–69. ISBN 978-0-470-40072-2.
- ^ Myers, Brad A. «Visual programming, programming by example, and program visualization: a taxonomy.» ACM SIGCHI Bulletin. Vol. 17. No. 4. ACM, 1986.
Further reading[edit]
- ISO 5807 (1985). Information processing – Documentation symbols and conventions for data, program and system flowcharts, program network charts and system resources charts. International Organization for Standardization.
- ISO 10628: Diagrams for the chemical and petrochemical industry
- ECMA 4: Flowcharts (withdrawn – list of withdrawn standards)
- Schultheiss, Louis A., and Edward M. Heiliger. «Techniques of flow-charting.» (1963); with introduction by Edward Heiliger.
External links[edit]
![]()
Wikimedia Commons has media related to Flow chart.
- Flowcharting Techniques: An IBM manual from 1969 (5 MB; PDF)
Смотреть что такое БЛОКСХЕМА в других словарях:
БЛОКСХЕМА
блок-схема
сущ., кол-во синонимов: 1
• схема (28)
Словарь синонимов ASIS.В.Н. Тришин.2013.
.
Синонимы:
схема
БЛОКСХЕМА
— система подмножеств конечного множества, удовлетворяющая нек-рым условиям, связанным с частотой появления пар элементов множества в подмножествах сис… смотреть
БЛОКСХЕМА
БЛОК-СХЕ́МА, и, ж., спец.1. Фізичне представлення задачі для її аналізу або розв’язування за допомогою спеціальних символів (геометричних образів), які… смотреть
БЛОКСХЕМА
Блок-схема (flowchart, flow diagram) — графическое представление задачи для проведения анализа или решения с помощью специальных символов, обозначающих такие элементы как операции, данные, поток или технические средства.<p>[ГОСТ 33707-2016. (ISO/IEC 2382:2015) Информационные технологии (ИТ). Словарь]</p><p><strong>Блок-схема</strong> — условное изображение программы для ЭВМ, отражающее структуру программы и последовательность операций.</p><p>[Грицык В.И., Космин В.В. Термины и понятия (словарь): Транспорт. Строительство. Экономика. Менеджмент. Маркетинг. Системотехника. Информатика. — М.: УМК МПС России, 2000]</p><p><strong>Блок-схема</strong> – графическая нотация для описания алгоритмов. Используется программистами в процессе разработки и анализа логики работы программных компонентов.</p><p>[Словарь программиста. (Электронный ресурс). http:// tiei.ru›wp-content/uploads/skachat-slovar-4.pdf/, свободный.]</p>… смотреть
БЛОКСХЕМА
(flowchart) Диаграмма, представляющая собой последовательность логических шагов, необходимых для решения проблемы. Полезный инструмент для программиста… смотреть
БЛОКСХЕМА
1) Орфографическая запись слова: блок-схема2) Ударение в слове: блок-сх`ема3) Деление слова на слоги (перенос слова): блок—схем4) Фонетическая транскр… смотреть
БЛОКСХЕМА
Блок-схема
Блок-схема — в программировании — графическое представление программы или алгоритма с использованием стандартных графических элементов (пр… смотреть
БЛОКСХЕМА
flow chart, block diagram, complete circuit diagram, flow diagram, skeleton diagram, flowchart, block scheme, flow scheme* * *блок-схе́ма м.flow chart,… смотреть
БЛОКСХЕМА
«Блок» здесь относится к последовательности событий. Блок-схема – графическое или пиктографическое представление такой, последовательности. Первоначально использовавшийся в программировании, этот термин был заимствован психологией наряду с общей методикой, представляющей собой способ схематического изображения последовательности событий, которые, как предполагается, происходят в процессе обработки информации…. смотреть
БЛОКСХЕМА
условное изображение алгоритма решения задачи, документооборота, последовательности выполнения рабочих операций или процедур с помощью стрелок, соедини… смотреть
БЛОКСХЕМА
Ablaufplan, Baugliedplan, Bausteinschaltbild, Blockplan, Blockdiagramm, (напр. программы) Flußdiagramm, Prinzipanordnung, Prinzipskizze, (алгоритма) St… смотреть
БЛОКСХЕМА
-и, ж. Схема, що складається з окремих елементів, блоків. •• Блок-схема програми — графічне зображення перебігу виконання програми за допомогою типово… смотреть
БЛОКСХЕМА
бло́к-схе́ма,
бло́к-схе́мы,
бло́к-схе́мы,
бло́к-схе́м,
бло́к-схе́ме,
бло́к-схе́мам,
бло́к-схе́му,
бло́к-схе́мы,
бло́к-схе́мой,
бло́к-схе́мою,
бло́к-схе́мами,
бло́к-схе́ме,
бло́к-схе́мах
(Источник: «Полная акцентуированная парадигма по А. А. Зализняку»)
.
Синонимы:
схема… смотреть
БЛОКСХЕМА
рос. блок-схема
графічне зображення алгоритму рішення задачі за допомогою спеціальних символів, що позначають такі елементи, як опис операцій і їх послідовність, залучення даних, їх обробка, технічні засоби, що використовуються для аналізу задачі або її розв’язання…. смотреть
БЛОКСХЕМА
1) <comput.> block diagram2) block representation3) flow chart4) flowchart5) skeleton diagram– блок-схема программыСинонимы: схема
БЛОКСХЕМА
блок-схема — block scheme, flow chart, block diagram — *Blockschema — схема машини, приладу, апарата, пристрою, в якій основні вузли (блоки), що утворюють її, зображено прямокутниками та іншими фігурами, а зв’язок між ними показано лініями зі стрілками…. смотреть
БЛОКСХЕМА
ж. diagramma m sinottico, schema m a blocchi; organigramma m
БЛОКСХЕМА
так принято называть схему, отражающую основные узлы какого-либо технического устройства (или процесса) с указанием связей между ними.Синонимы: схема
БЛОКСХЕМА
блок-схе́ма
(від блок (1) і схема)
схема машини, приладу, апарата, пристрою, в якій основні вузли (блоки), що утворюють її, зображено прямокутниками та іншими фігурами, а зв’язок між ними показано лініями з стрілками…. смотреть
БЛОКСХЕМА
ж.Blockschaltbild n, Blockschaltplan m, Übersichtschaltplan m, Strukturdiagramm nСинонимы: схема
БЛОКСХЕМА
блок-схема; ж.
(блок і схема)
схема машини, приладу, апарата, пристрою, в якій основні вузли (блоки), що утворюють її, зображено прямокутниками та іншими фігурами, а зв’язок між ними показано лініями з стрілками…. смотреть
БЛОКСХЕМА
Ударение в слове: блок-сх`емаУдарение падает на букву: еБезударные гласные в слове: блок-сх`ема
БЛОКСХЕМА
Графическое представление потока информации; изображение процесса, при котором для обозначения операций, данных, формируемых отчетов, оборудования и т.п. используются условные обозначения. … смотреть
БЛОКСХЕМА
бло`к-схе’ма, бло`к-схе’мы, бло`к-схе’мы, бло`к-схе’м, бло`к-схе’ме, бло`к-схе’мам, бло`к-схе’му, бло`к-схе’мы, бло`к-схе’мой, бло`к-схе’мою, бло`к-схе’мами, бло`к-схе’ме, бло`к-схе’мах… смотреть
БЛОКСХЕМА
-и, ж. Схема, що складається з окремих елементів, блоків.Блок-схема програми — графічне зображення перебігу виконання програми за допомогою типової сим… смотреть
БЛОКСХЕМА
diagramme de blocs, diagramme de circulation, bloc-diagramme, diagramme d’ensemble, diagramme fonctionnel, ordinogramme, tableau synoptique
БЛОКСХЕМА
блок-схемаתַרשִים זרִימָה ז’Синонимы: схема
БЛОКСХЕМА
Графический систематизатор, показывающий, какие действия должны быть осуществлены, если выполняются или не выполняются какие-либо предварительные условия…. смотреть
БЛОКСХЕМА
статическое или динамическое отображение каких-либо объектов с помощью символов, стрелок, графов, соединительных линий и геометрических фигур, текстов. … смотреть
БЛОКСХЕМА
тех.flow chart, flow sheet, block diagram
БЛОКСХЕМА
ж.block diagram, flow diagram, skeleton diagram, flowchart
БЛОКСХЕМА
Начальная форма — Блок-схема, единственное число, женский род, именительный падеж, неодушевленное
БЛОКСХЕМА
(программы или алгоритма) flow chart, block diagram, flow diagram, flowchart, flow sheet, sheet
БЛОКСХЕМА
flow chart, block schematic diagram, flow diagram, schematic diagram, flowchart, flow-diagram
БЛОКСХЕМА
• blokové schéma• blokové zapojení• blokový diagram
БЛОКСХЕМА
esquema sinóptico, diagrama sinóptico, diagrama de bloques
составлять блок-схему
БЛОКСХЕМА
1) flowchart, flow chart 2) logic diagram
БЛОКСХЕМА
bloque-esquema прогр., esquema en bloque
БЛОКСХЕМА
БЛОК-СХЕМА — bar chart; flow diagram.
Разбор слова по составу блок-схема
Разбор слова «блок-схема» по составу: слово блок-схема имеет корень «блок», корень «схем», окончание «а»
блок-схема
Как пишется слово блок-схема?
Правильно пишется: блок-схема
Разбор слова «блок-схема»
| корень | блок |
| корень | схем |
| окончание | а |
Другие формы слова «блок-схема»
Базовая форма слова БЛОК-СХЕМА
| Ед. число | Мн. число | |
|---|---|---|
| Им. | блок-схема | блок-схемы |
| Род. | блок-схемы | блок-схем |
| Дат. | блок-схеме | блок-схемам |
| Винит. | блок-схему | блок-схемы |
| Тв. | блок-схемой, блок-схемою |
блок-схемами |
| Пред. | блок-схеме | блок-схемах |
Примеры со словом блок-схема
Мне не хватало блок-схемы устройства мира.
Всем, кроме его величества, введена блок-схема пятого уровня.
Он всё-таки заметил блок-схему. Нужно было её припрятать.
Составление и использование блок-схем.
Это своеобразная блок-схема ваших рассуждений.
Параллельно на экране идут строчки кода и разные блок-схемы.
Узнайте как пишется слово «спрыснуть»
53% ошибается при написании этого слова, проверьте свои знания